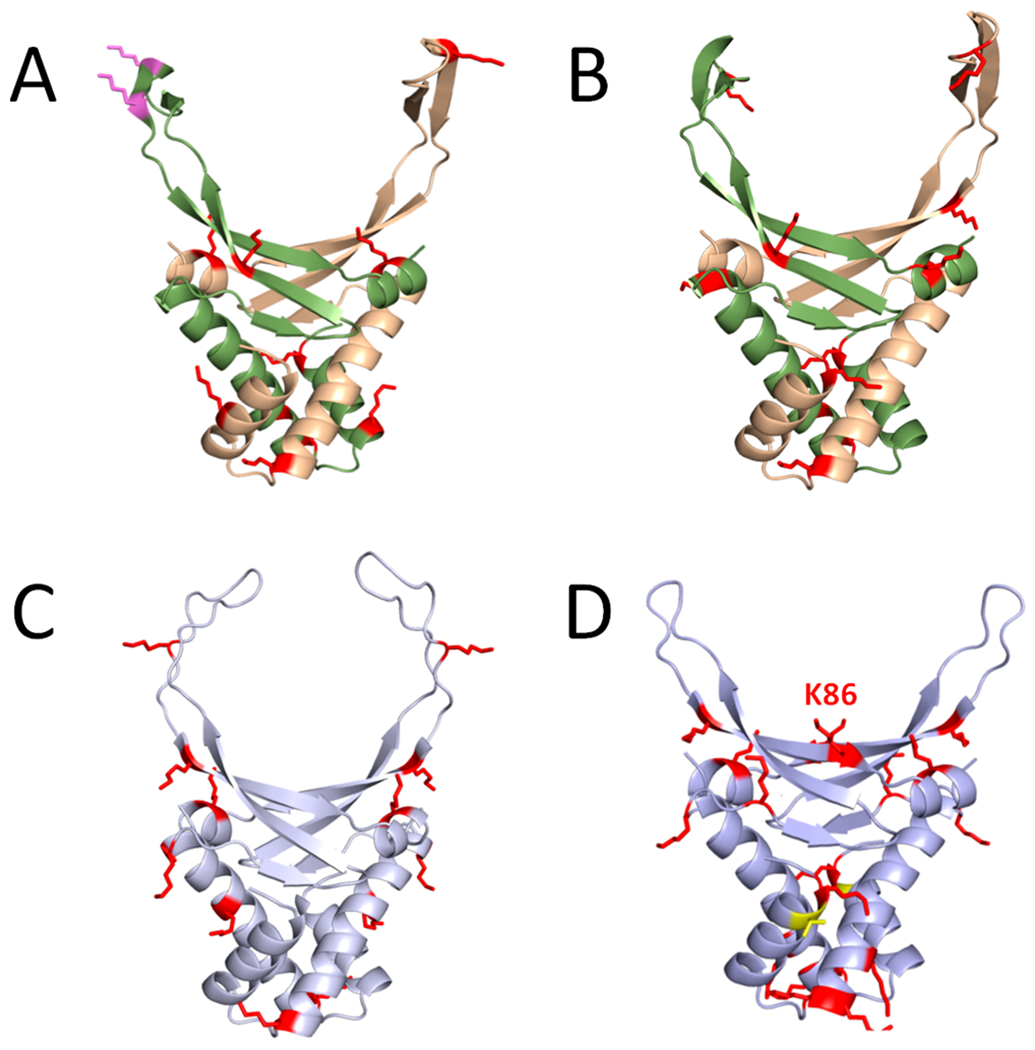
Figure 3.

Structural location of PTMs on HU orthologues. Computational models of (A) E. coli HupA–HupB heterodimer, (B) V. alginolyticus HupA–HupB heterodimer, (C) S. eriocheiris HupA homodimer, and (D) B. subtilis HBsu homodimer are shown. For the heterodimers depicted in (A) and (B), the HupA subunit is colored green, and the HupB subunit is colored tan. Both monomers of the homodimers are depicted in (C) and (D). Acetylated residues are shown as red sticks, and phosphorylated residues are shown as yellow sticks; succinylated residues that do not overlap with an acetylation site are shown as pink sticks. The comparative models were generated using Phyre2.120 The Anabaena HU–DNA cocrystal structure (Protein Data Bank code 1P71) was used as the modeling template. Molecular graphics were produced with PyMOL.121
