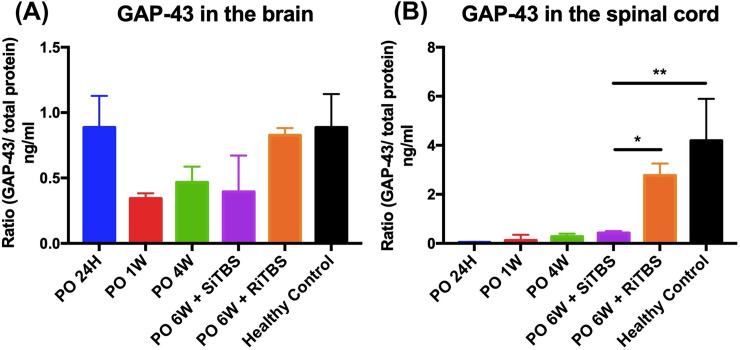
Fig 6. Time course of average changes in expressions of growth-associated protein (GAP)-43.
GAP-43 levels in the brain (A and spinal cord (B) at different time points. Each different time point in both the brain and spinal cord corresponded to the ratio of GAP-43/total protein. * p < 0.05, ** p < 0.01, by post-hoc LSD multiple-comparison tests on GAP-43 expression from each time point compared to the severe-spinal cord injury (SCI) + sham intermittent theta-burst stimulation (SiTBS) group.

