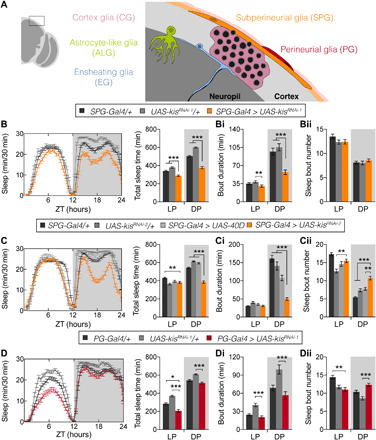
Fig. 3. Kismet function in sleep integrity maps to SPG of the BBB.

(A) Schematic representation of glia subtypes in the adult Drosophila brain. (B to D) Sleep profiles and quantification. (Bi, Ci, and Di) Average duration and (Bi, Ci, and Di) number of sleep bouts in the LP (ZT0 to ZT12) and DP (ZT12 to ZT24). (B, Bi, and Bii) Kismet knockdown in SPG with the R54C07-Gal4 driver (SPG-Gal4 > UAS-kisRNAi-1, in orange, n = 104) compared to background controls (SPG-Gal4/+, in black, n = 134; UAS-kisRNAi-1/+ in gray, n = 85) shows reduced sleep time during both LP (P = 0.0006) and DP (P < 0.0001), due to shorter sleep bouts (P < 0.0001). (C, Ci, and Cii) Kismet knockdown in SPG with the R54C07-Gal4 driver (SPG-Gal4 > UAS-kisRNAi-2, in orange, n = 108) compared to background controls (SPG-Gal4/+, in black, n = 150; UAS-kisRNAi-2/+ in dark gray, n = 86) and UAS-40D control (SPG-Gal4 > UAS-40D, in light gray, n = 66) shows reduced sleep time during DP (P < 0.0001). Knockdown flies also display shorter nighttime bouts (P < 0.0001) accompanied by an increase in their number (P < 0.0001 and P = 0.0024, respectively). (D, Di, and Dii) Kismet knockdown in PG with the R85G01-Gal4 driver (PG-Gal4 > UAS-kisRNAi-1, in red, n = 80) compared to background controls (PG-Gal4/+ controls in black, n = 84; UAS-kisRNAi-1/+ in gray, n = 62) shows reduced sleep time at LP (P = 0.013 and P < 0.0001, respectively). Nighttime sleep is unaffected. Data are represented as means ± SEM. Kruskal-Wallis test with Dunn’s correction. Bonferroni correction for multiple testing. P values are indicated as follows: *P < 0.05, **P < 0.01, and ***P < 0.001. See also figs. S5 and S6.
