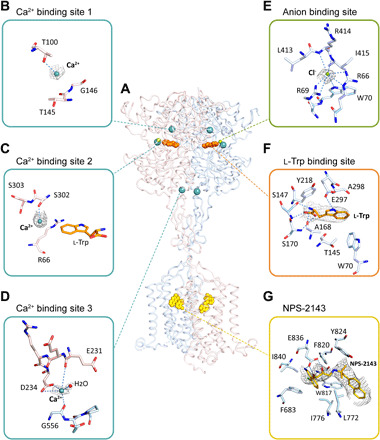
Fig. 2. Ligand recognition of the ggCaSR-NAM structure.

(A) Overall picture of ligands bound in the receptor structure. Ligands are shown as spheres with different colors. (B to D) Three Ca2+-binding sites in the ggCaSR-NAM structure. Ca2+ ions are drawn as cyan spheres. (E) Anion binding site. Cl− ions are drawn in green. (F) l-Trp binding site. l-Trp is shown in orange. (G) Binding pocket of NPS-2143 in the 7TMD. NPS-2143 is shown in yellow. For (B) to (G), the surrounding residues around different ligands are shown in stick models. The gray mesh represents the density map of the ligand, and the dotted line represents a hydrogen bond. Oxygen and nitrogen atoms are colored red and blue, respectively, and carbon atoms are colored according to the protomer color.
