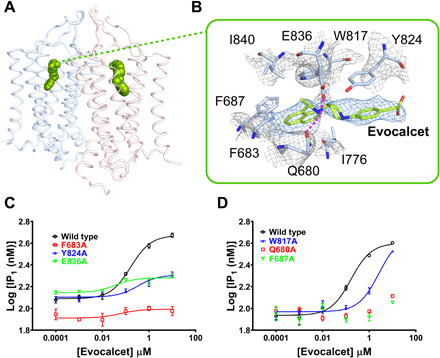
Fig. 3. Evocalcet binding in the ggCaSR-PAM structure.

(A) Overall view of evocalcet bound in two 7TMDs of the receptor. Evocalcet is shown as green spheres. Two 7TMDs are represented as cartoon model and colored differently. (B) Binding pocket of evocalcet in the 7TMD. Evocalcet and the surrounding residues are shown in stick models. The mesh colored gray and blue represents the density map, and the magenta dotted lines represent hydrogen bonds. Oxygen, nitrogen, and carbon atoms in CaSR are colored red, blue, and pale blue, respectively. Carbon atoms in evocalcet are colored green. (C) Concentration-response binding curves of evocalcet for the ggCaSR wild type (black), the mutant F683A (red), the mutant Y824A (blue), and the mutant E836A (green) by IP1 production assay. (D) Concentration-response binding curves of evocalcet for the ggCaSR wild type (black), the mutant W817A, the mutant Q680A (red), and the mutant F687A (green) by IP1 production assay.
