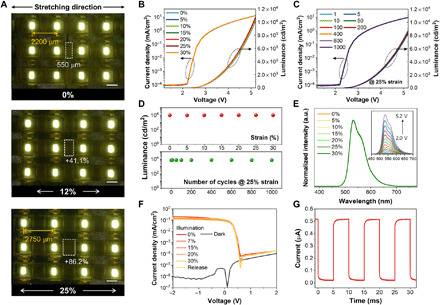
Fig. 4. Characteristics of stretchable OLED and OPD.

(A) Microscopic images of stretchable OLED pixels under strains of 0, 12, and 25%. The yellow arrows and dashed white boxes indicate the pixel-to-pixel distance and length of the micro-cracked Au interconnect before and after stretching, respectively (scale bar, 1000 μm). The distance between the pixels increased by 25%, while the length of the cracked Au interconnects increased by 86% (dashed white box). (B and C) Current density–voltage–luminance characteristics of the stretchable OLEDs at strains ranging from 0 to 30% (B) and after stretching cycles at 25% strain (C). (D) Variation in the luminance of the stretchable OLED at strains ranging from 0 to 30% (top) and after stretching cycles at 25% strain (bottom). (E) Normalized electroluminescence spectra of the stretchable OLED at strains ranging from 0 to 30%. Inset: Electroluminescence spectra of the stretchable OLED at different voltages (2.0 to 5.2 V). a.u., arbitrary units. (F) Current density–voltage characteristics of the stretchable OPD under dark and illumination conditions at strains ranging from 0 to 30%. (G) Dynamic response of the stretchable OPD.
