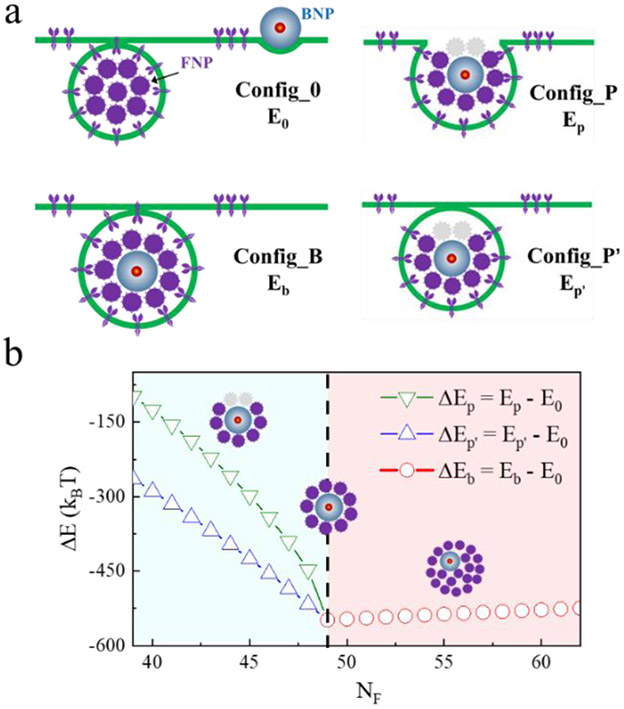
Fig. 6.
Energy analysis of the bystander uptake effect. (a) Sketches showing some typical interaction states between the NPs (i.e., FNPs and BNPs) and the membrane. (b) Changes of energy differences between the different states with the FNP number NF. Insets show the possible covering situations of FNPs around BNPs. NB = 1, rF = 10 nm, rB = 25 nm.

