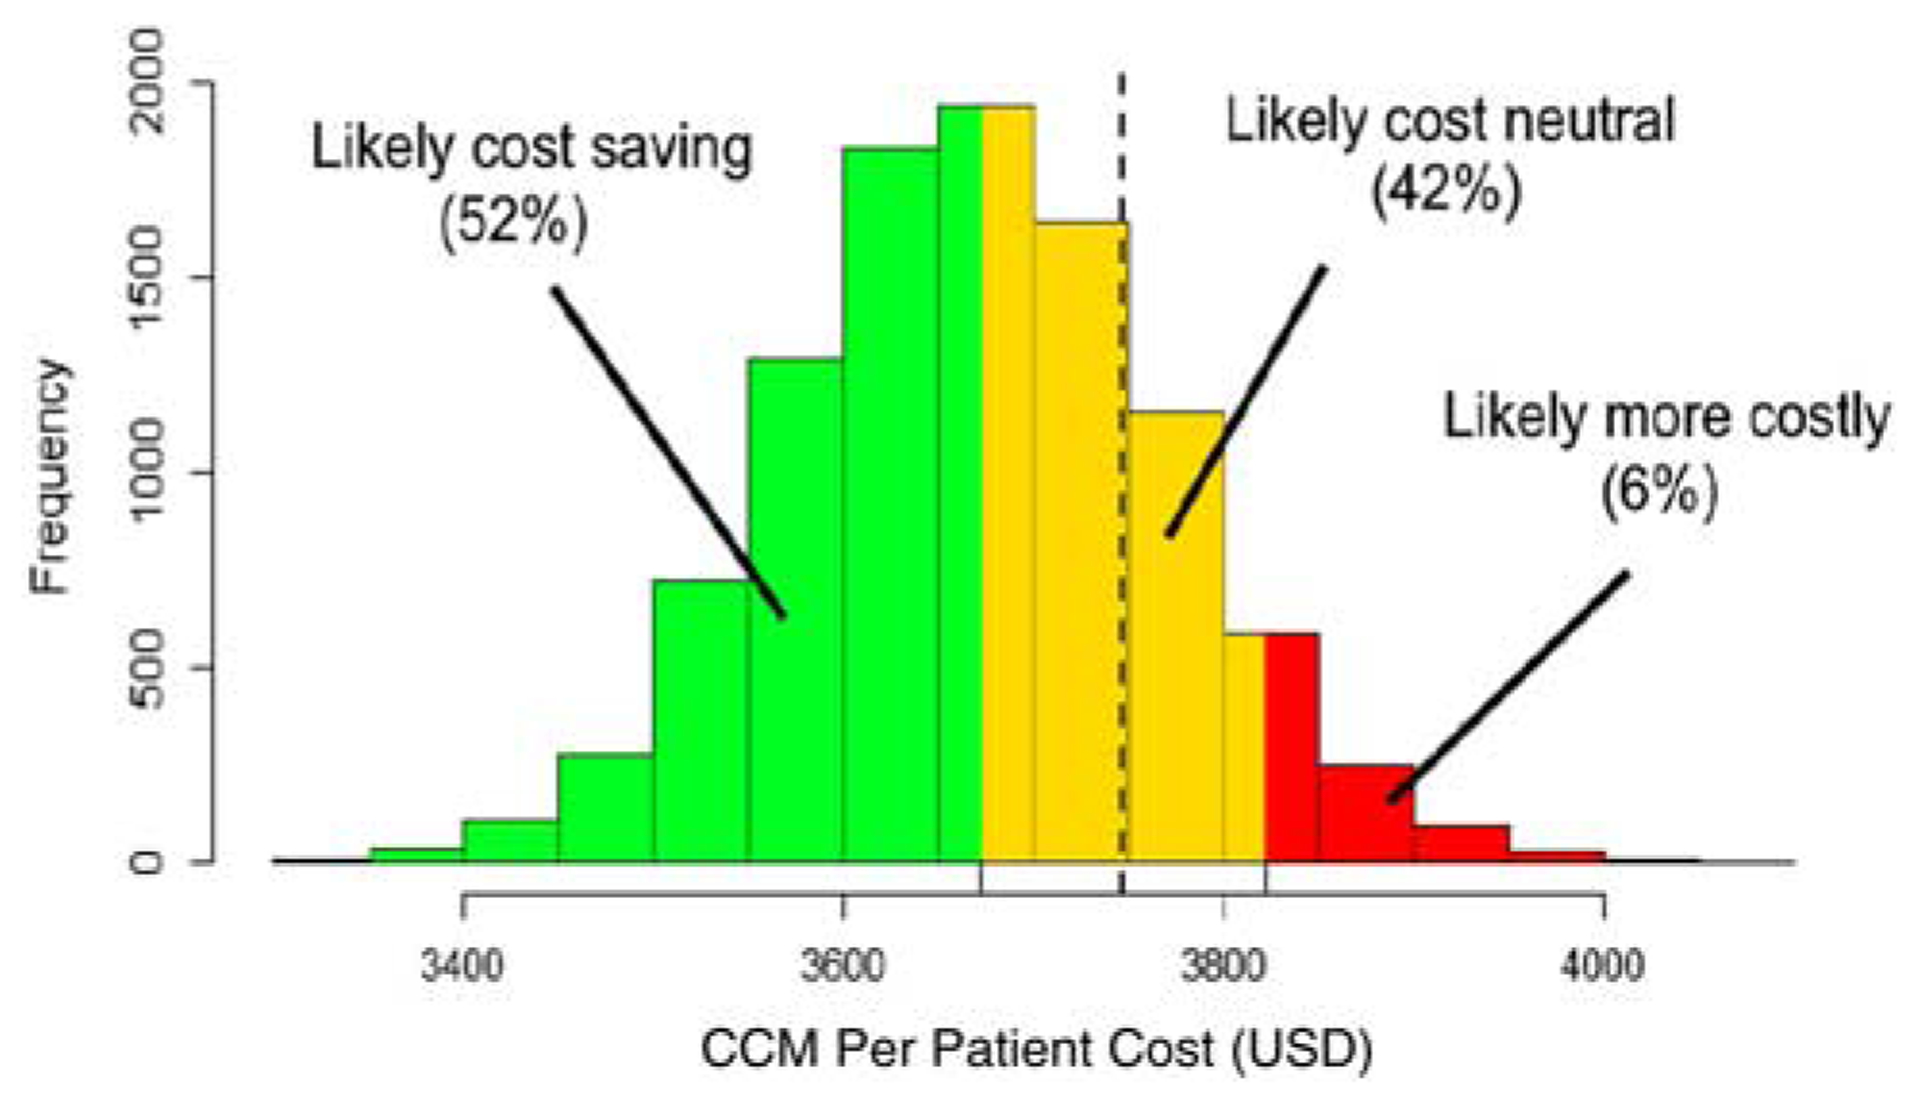
FIGURE 1.

Cost histogram of simulation results for Collaborative Chronic Care Model (CCM) implementation. The figure displays the probabilistic sensitivity analysis results for the per-patient costs of CCM implementation. We used Monte Carlo simulation (n = 10,000 replications) to model the sensitivity of our results to changes in various cost drivers. The dashed vertical line represents the average per-patient costs for care as usual ($3747).
