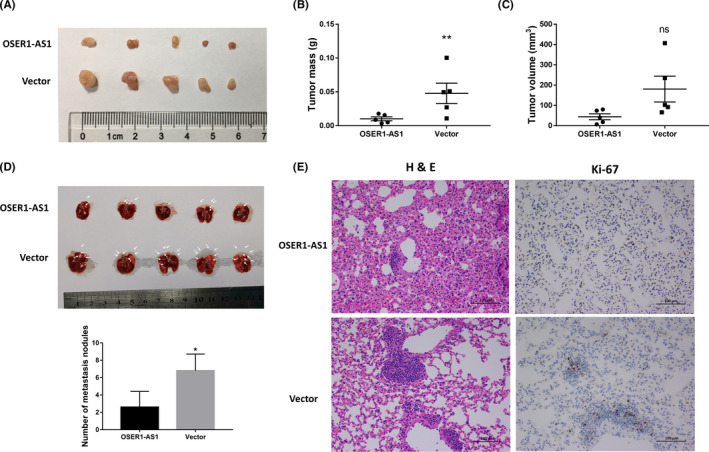
Figure 3.

Overexpression of OSER1‐AS1 inhibits lung cancer cell growth and metastasis in vivo. A, Tumors from the OSER1‐AS1 and vector control groups upon resection from BALB/c‐nude mice 5 weeks after s.c. injection with stable transfected A549 cells (5.0 × 10⁶) into the left flanks. B, Tumor weight from the OSER1‐AS1 and vector control groups. Lines represent the mean and SEM of five independent experiments. **, OSER1‐AS1 vs vector control, Mann‐Whitney U test, P < .01. C, Tumor volume was calculated using the equation V = 0.5 × D × d 2 (V, volume; D, longitudinal diameter; d, latitudinal diameter). Lines represent the mean and SEM of five independent experiments. ns (nonsignificant), OSER1‐AS1 vs vector control, Mann‐Whitney U test, P > .05. D, Lungs from nude mice in each group 5 weeks after injection of stable transfected A549 cells (1.0 × 10⁶). Top panel: Arrows point to tumor nodules on the lung surface. Bottom panel: number of lung metastatic nodules on lung surfaces was counted. *OSER1‐AS1 vs vector control, Mann‐Whitney U test, P < .05. E, Left panels: H&E staining of lung tissue slices showed that more metastatic nodules were present in the vector control group than in the OSER1‐AS1 overexpression group. Magnification, ×200. Right panels: immunohistochemical analysis of proliferation marker Ki‐67 shows that Ki‐67 expression levels were significantly lower in the OSER1‐AS1 overexpression group than those in the control vector group
