
Figure 5.
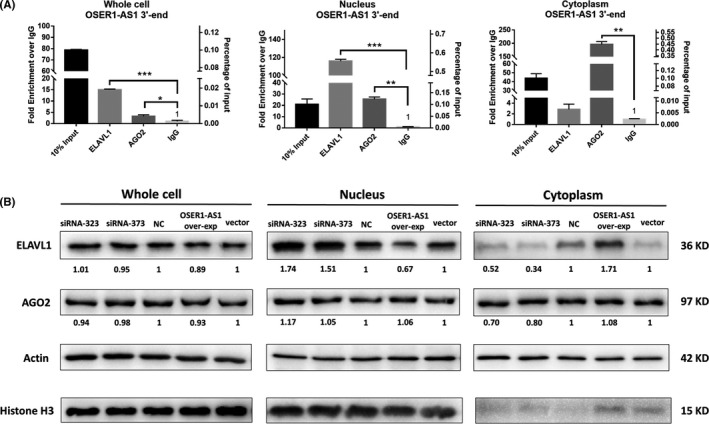
Long non‐coding RNA (lncRNA)‐protein interaction between OSER1‐AS1 and ELAVL1. A, RNA immunoprecipitation (RIP) was performed in H1299 cells using either control IgG, anti‐ELAVL1 or anti‐AGO2 antibodies. Immunoprecipitated OSER1‐AS1 RNA was quantified by qRT‐PCR. Relative abundance of RNA‐protein complex in cell lysate was expressed as either fold enrichment normalized to the control IgG (Left Y‐axis) or percentage of input (Right Y‐axis). Error bars represent the SD of three independent experiments. Two‐tailed Student’s t test: *P < .05; **P < .01; ***P < .001. B, Protein expression levels of ELAVL1 and AGO2 in H1299 cells were detected by western blot after knockdown and overexpression of OSER1‐AS1. Cell lysates were collected for western blotting 48 h post‐transfection. The numbers below the bands indicate the fold change of quantitative analysis results. Beta‐actin was used as positive control for whole cell and cytoplasmic cell lysate. Histone H3 was used as positive controls for nucleus lysate