FIGURE 1.

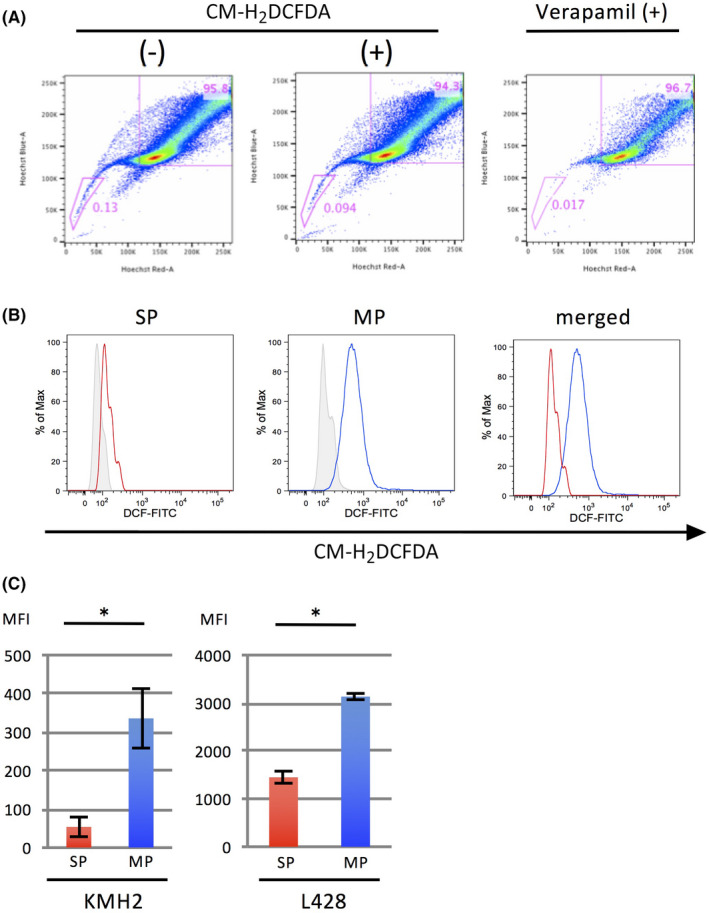
Intracellular ROS levels are lower in the SP compared to the MP in HL cell lines. A, Analysis of SP cells in an HL cell line, KMH2. The cells with or without treatment by CM‐H2DCFDA, an indicator of intracellular ROS production, are presented in the middle and on the left, respectively. The SP fraction is reduced by treatment with verapamil, a Ca2+ ion channel blocker (right). The percentage of SP cells is indicated in each graph. B, Histograms of CM‐H2DCFDA intensity in SP cells and MP cells are presented on the left and in the middle, respectively. The results from cells without treatment are indicated as gray shaded histograms. The histograms merged are shown on the right. C, Bar graphs of mean fluorescence intensity (MFI) of SP and MP cells of HL cell lines KMH2 and L428 treated with CM‐H2DCFDA. *, P < .05 [Correction added on 8 April 2021, after first online publication: In Figure 1, the text ‘CH‐H2DCFDA‘ in 1A and 1B images has been corrected to ‘CM‐H2DCFDA’.]
