FIGURE 2.

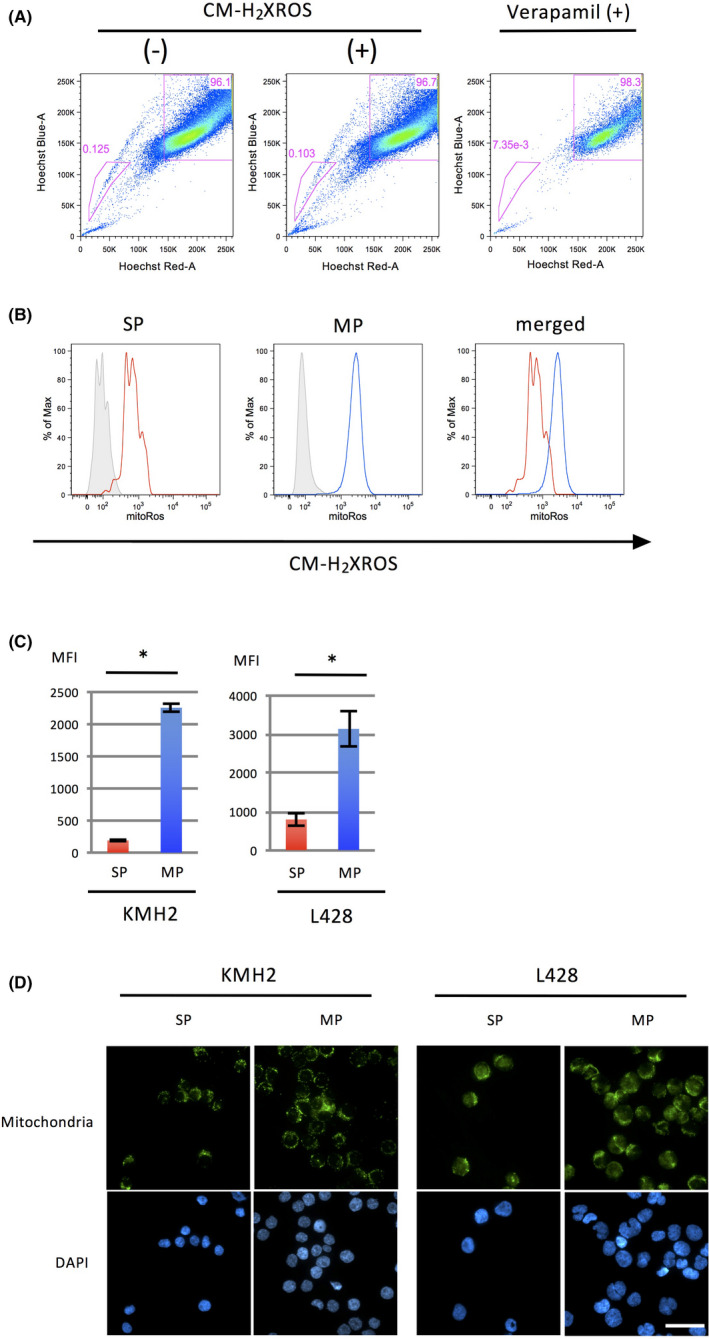
The MP of HL cell lines increased mitochondrial ROS compared to the SP. A, Analysis of SP cells in an HL cell line, L428. Cells with or without treatment by CM‐H2XRos, an indicator of mitochondrial ROS production, are presented in the middle and on the left, respectively. The SP fraction is reduced by treatment with verapamil, a Ca2+ ion channel blocker (right). The percentage of SP cells is indicated in each graph. B, Histograms of CM‐H2XRos intensity in SP and MP cells of L428 are presented on the left and the middle, respectively. Cells without treatment are indicated as gray shaded histograms. The histograms merged are shown at the right. C, Bar graphs of MFI of SP and MP cells of HL cell lines KMH2 and L428 treated with CM‐H2XRos. The experiments were performed three times independently. *, P < .05. D, Immunostaining of mitochondria in SP and MP cells of HL cell lines. SP and MP cells (5.0 × 10⁴) of each cell line were sorted and cytospun onto slides and stained with an anti‐mitochondrial antibody (top). DAPI staining of each cell line is presented in the bottom panels. These cells were analyzed using fluorescence microscopy. Scale bar, 100 μm
