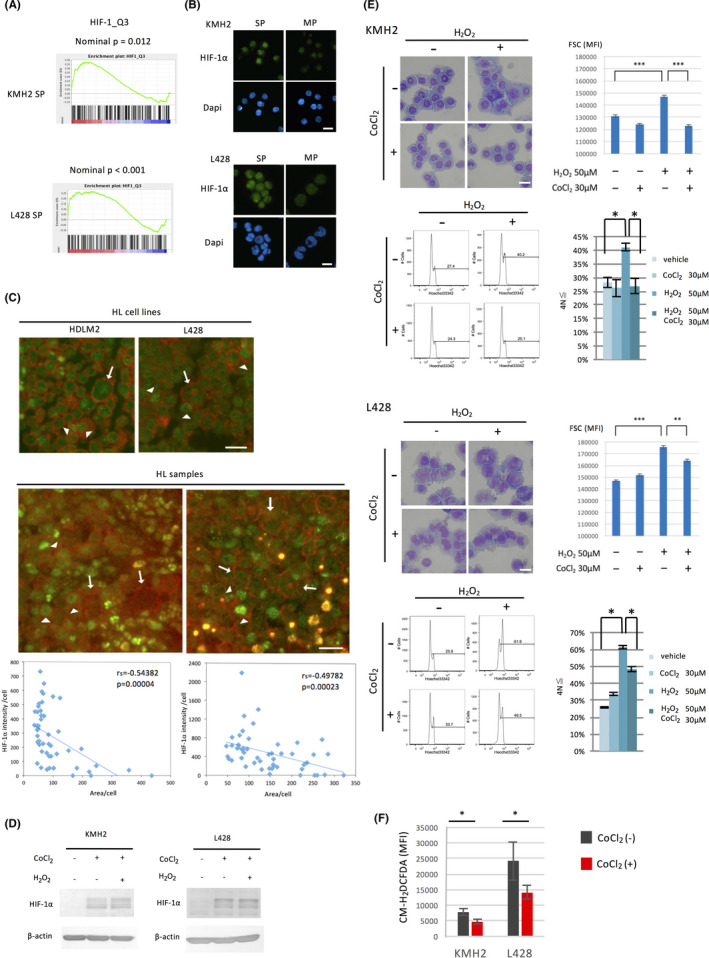
FIGURE 5.

HIF‐1α, preferentially expressed in the SP, prevents ROS‐mediated differentiation of HL cell lines. A, GSEA comparing SP cells with MP cells using the gene set HIF1_Q3, which includes 230 genes with HIF‐1 binding motifs on their promoter regions. B, Analysis of the expression of HIF‐1α in SP and MP cells of HL cell lines. The cells were sorted by flow cytometry, cytospun onto glass slides, and stained with an anti‐HIF‐1α antibody. The nuclei were stained with DAPI. Scale bar, 50 μm. C, Analysis of the expression of HIF‐1α in H and RS cells of HL samples by immunostaining of HIF‐1α and CD30. The staining of the HL cell lines used as reference is shown (top). The representative results from five samples examined are presented (bottom). Among cells stained by anti‐CD30 antibody Ber‐H2, arrows and arrowheads show large cells with weak HIF‐1α staining and smaller cells with strong HIF‐1α staining, respectively. Scale bar, 20 μm. Integrated fluorescent intensity for HIF‐1α per each cell was calculated (50 cells) by measurement of the area of each cell stained with anti‐CD30 antibody as strong as giant RS cells and by the mean fluorescent intensity by ImageJ software. When the mean fluorescent intensity of the area is equal or less than that of the background, the intensity was set to 0. Scatter plots for the area and the intensity with linear regression lines are presented below each immunofluorescence staining image. rs, Spearman's correlation coefficient. D, Analysis of the expression of HIF‐1α by CoCl2 and hydrogen peroxide (H2O2). HL cell lines (1 × 10⁵/mL) were cultured with or without the HIF‐1α stabilizer, CoCl2 (30 μmol/L), and hydrogen peroxide (50 μmol/L) for 24 h, then harvested and used for immunoblot analysis. E, Inhibition of ROS‐mediated differentiation of HL cell lines by the induction of HIF‐1α. HL cell lines were cultured with or without CoCl2 (30 μmol/L) and hydrogen peroxide (50 μmol/L) for 48 h. The morphological changes were examined using the May‐Giemsa method and flow cytometry (top left and right of each HL cell line). Scale bar, 50 μm. Ploidy of the cells was analyzed using flow cytometry, and representative DNA histograms are shown (bottom left of each HL cell line). The percentage of the ≧ 4N cells was calculated as described in Figure 3B (bottom right of each HL cell line). *P < .05, **P < .01, ***P < .001. F, Effect of CoCl2 on intracellular ROS production in HL cell lines. HL cell lines were cultured with or without CoCl2 (30 μmol/L) for 24 h. Intracellular ROS production was measured using CM‐H2DCFDA by flow cytometry. MFI is shown as bar graphs. *P < .05
