FIGURE 2.

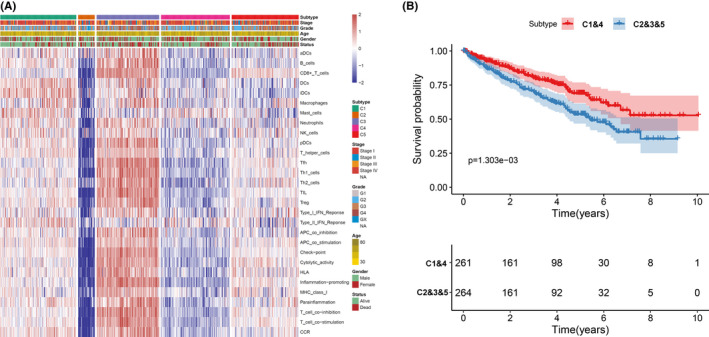
The association between clinical traits and subgroups. (A) A heatmap including the clinical traits and 29 immune signatures. (B) Cluster survival analysis of subgroups C1&4 and C2&3&5

The association between clinical traits and subgroups. (A) A heatmap including the clinical traits and 29 immune signatures. (B) Cluster survival analysis of subgroups C1&4 and C2&3&5