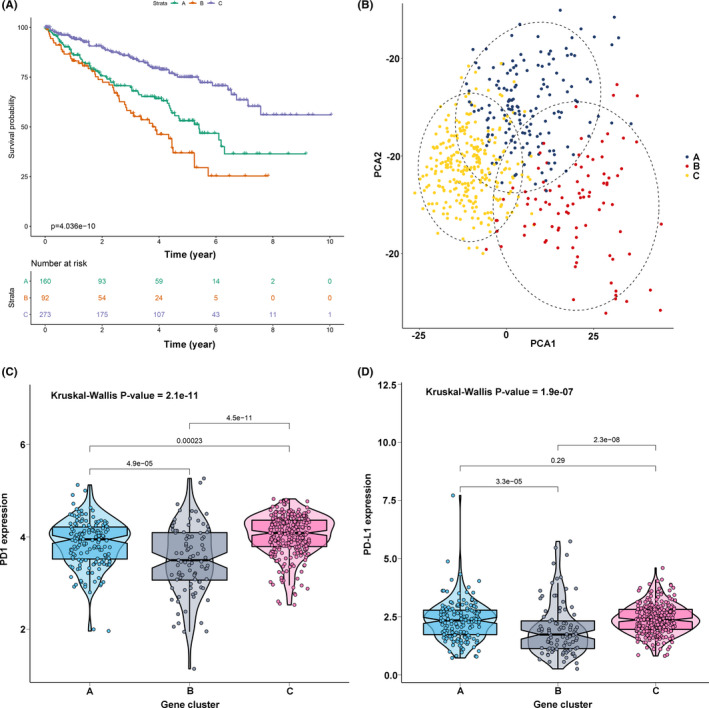
FIGURE 4.

Identification of gene cluster. (A) KM survival curve analysis of the three gene clusters. (B) Principal component analysis supported the stratification into three gene clusters of clear cell renal cell carcinoma (ccRCC). (C) Comparisons of expression level of PD1 in three gene clusters. (D) Comparisons of expression level of PD‐L1 in three gene clusters
