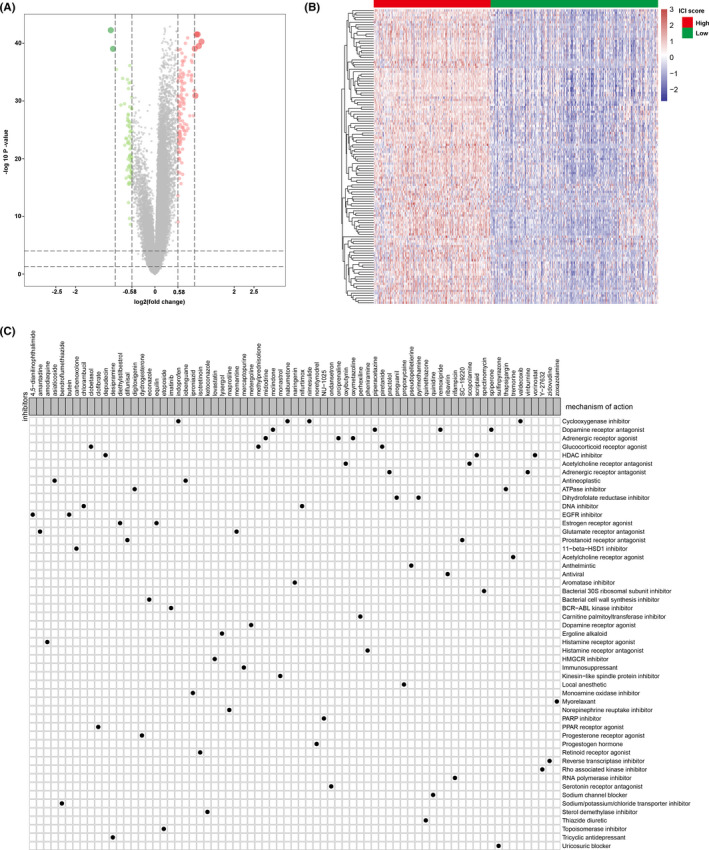
FIGURE 10.

Small molecular compounds identification based on the differentially expressed genes. (A) Volcano plot for the differentially expressed genes; green dots represent the downregulated genes, red dots represent the upregulated genes, and the gray dots represent the non‐significant genes. (B) Heatmap of the differentially expressed genes expression. (C) Small molecular compound identification through CMap analysis based on the differentially expressed genes
