
FIGURE 12.
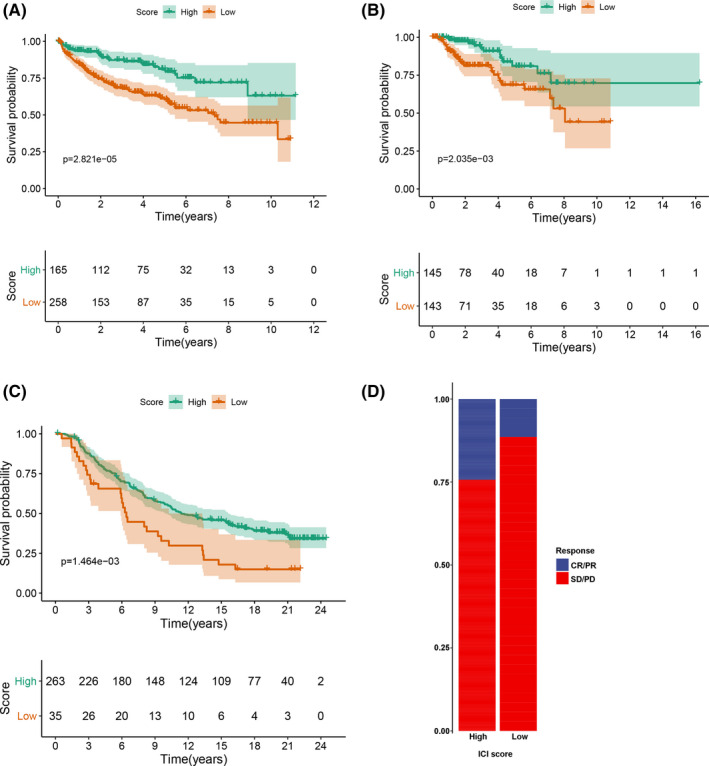
Validation of the tumor immune infiltration (TII) score. (A) KM survival curve analysis of tumor immune infiltration (TII) score group in the disease‐free survival dataset. (B) KM survival curve analysis of the TII score group in the papillary renal cell carcinoma dataset. (C) KM survival curve analysis of TII score group in the IMvigor210 dataset. (D) Rate of clinical response (CR/PR and SD/PD) in TII score groups in the IMvigor210 cohort