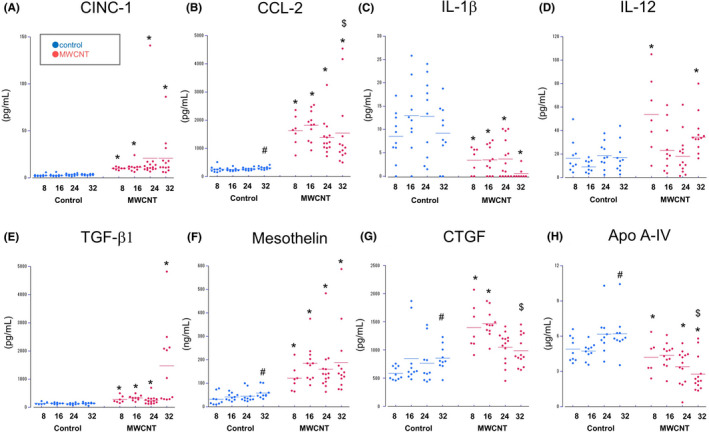
FIGURE 3.

Time‐course of the levels of humoral factors in the PLF. Scatter plots for CINC‐1 (A), CCL‐2 (B), IL‐1β (C), IL‐12 (D), TGF‐β1 (E), mesothelin/N‐ERC (F), CTGF (G) and Apo A‐IV (H). Bars show mean values in each time point. Significant changes were denoted by letters: differences between control and dosed groups (*); tendencies of increase (#) or decrease ($) from Wk‐8 to Wk‐32
