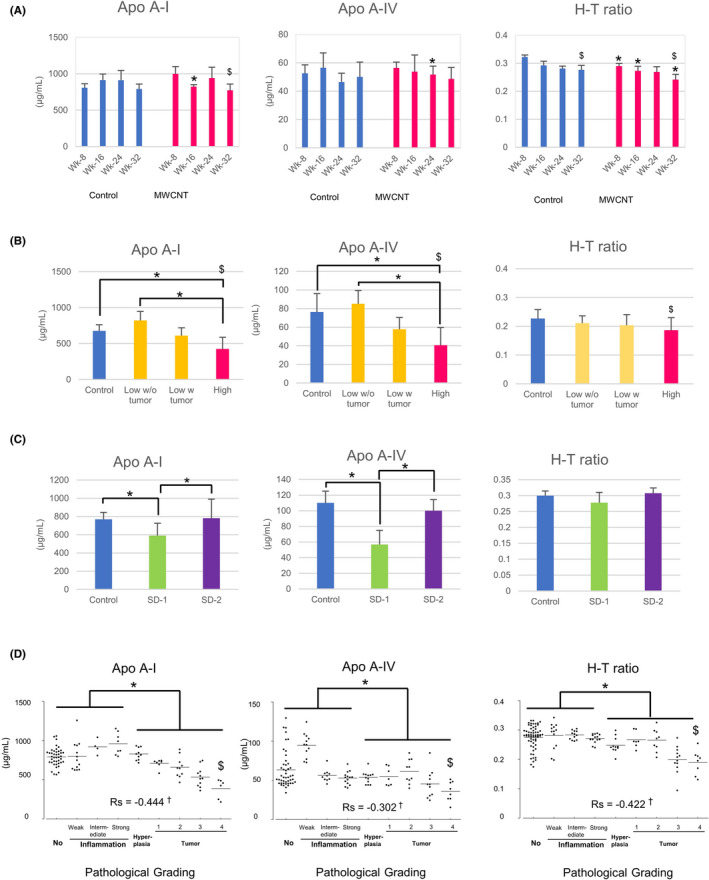
FIGURE 4.

Serum levels of apolipoproteins and cholesterols. Mean values with standard deviations of Apo A‐I, Apo A‐IV, and H‐T ratio in Experiment 1 (time‐course analysis) (A), Experiment 2 (dose‐dependent carcinogenicity) (B), and Experiment 3 (different types of MWCNTs) (C). Scatter plots of integrated data of the 3 experiments (D). Bars show mean values. Rs: Spearman Rho value. Significant changes were denoted by letters: differences between the 2 groups (*); tendencies of decrease ($) with a time‐dependency (A), a tumor burden (B), and a histological grading (D); correlation of the lipoprotein‐related parameters and the pathological grading (†)
