
FIGURE 7.
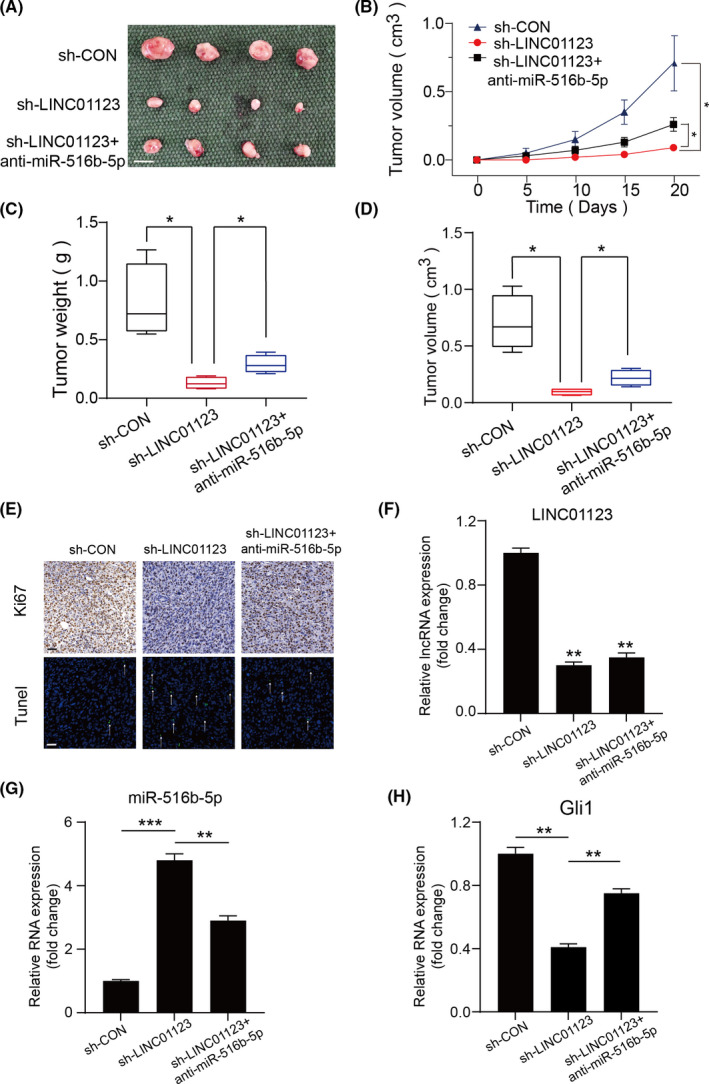
LINC01123 promoted cell growth by sponging miR‐561b‐5p in vivo. A, Morphologic characteristics of xenograft tumors from U‐2OS/sh‐Control group, U‐2OS/sh‐LINC01123 group and U‐2OS/sh‐LINC01123 + anti‐miR‐561b‐5p group (n = 4). Scale bars =1 cm. B, The tumor volumes were measured with calipers every 5 days. Data were presented as the mean ±SD, *P <.05. C, Tumor weights at 20 days were measured in each group. The median, upper, and lower quartiles were plotted, and the whiskers that extend from each box indicate the range of values that were outside of the intra‐quartile range. n = 4, *P <.05. D, Tumor volumes at 20 days were measured in each group. The median, upper, and lower quartiles were plotted, and the whiskers that extend from each box indicate the range values that were outside of the intra‐quartile range. n = 4, *P <.05. E, Representative images of Ki67 and TUNEL staining in the xenograft tumors from the sh‐Control, sh‐ LINC01123 and sh‐LINC01123 + anti‐miR‐561b‐5p mice. A TUNEL positive cell is indicated (arrow). Scale bars =50μm. F‐H, The expression of LINC01123, miR‐561b‐5p and Gli1 in xenografts was examined by RT‐qPCR. Data were presented as the mean ±SD, **P <.01, ***P <.001