
FIGURE 1.
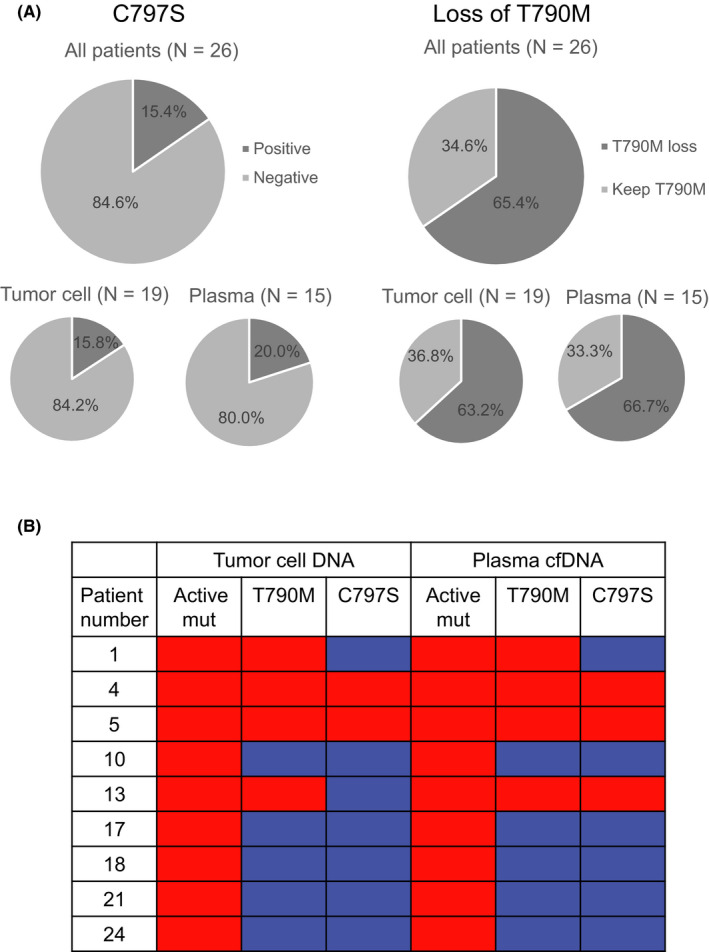
A, Frequency of C797S and T790M loss detected by droplet digital PCR (ddPCR). B, The concordance of T790M and C797S detection with ddPCR between tumor cell DNA and plasma cfDNA. Red: positive. Blue: negative
Official websites use .gov
A
.gov website belongs to an official
government organization in the United States.
Secure .gov websites use HTTPS
A lock (
) or https:// means you've safely
connected to the .gov website. Share sensitive
information only on official, secure websites.
A, Frequency of C797S and T790M loss detected by droplet digital PCR (ddPCR). B, The concordance of T790M and C797S detection with ddPCR between tumor cell DNA and plasma cfDNA. Red: positive. Blue: negative