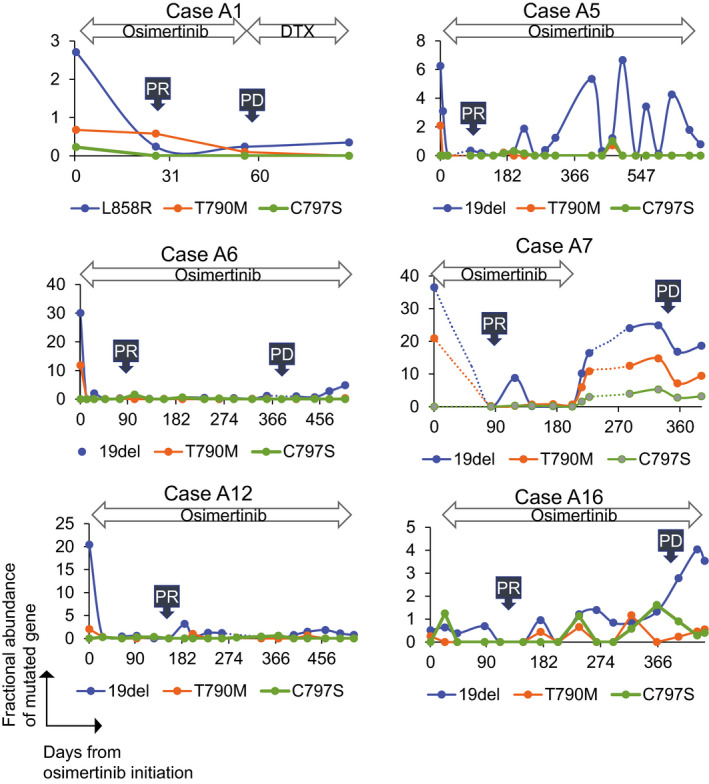
FIGURE 4.

Fractional abundance chart of epidermal growth factor receptor (EGFR) mutation in 6 patients. Fractional abundance of EGFR mutation is shown on the vertical axis, whereas the days from osimertinib initiation is shown on the horizontal axis. C797S was detected in 1 patient (Case A7) at least once during the follow‐up period. RT, radiation therapy
