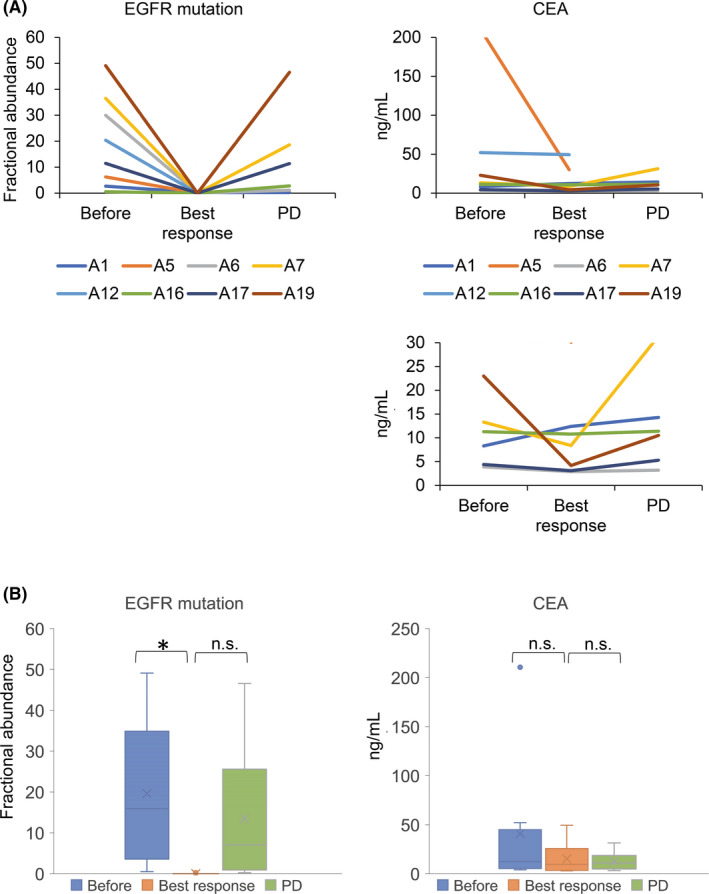
FIGURE 6.

A, Fractional abundance of epidermal growth factor receptor (EGFR)‐activating mutation and carcinoembryonic antigen (CEA) before the osimertinib treatment, best osimertinib response, and disease progression are described in the graph. The two types of vertical axis were shown to estimate the variation precisely. B, Fractional abundance of EGFR‐activating mutation was significantly different between pretreatment and at the time of best response
