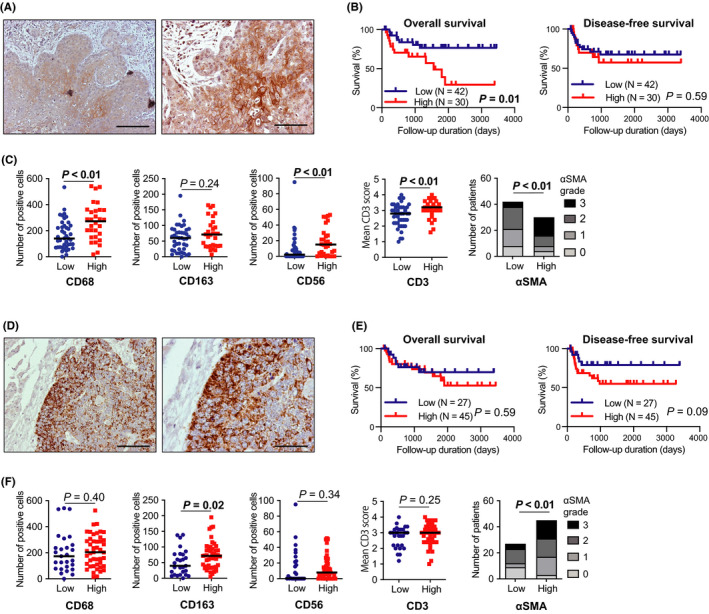
FIGURE 3.

AKT3 expression in tumor cells correlates with immune cell infiltration and poor prognosis in HNSCC. Immunohistochemistry (IHC) staining of 72 surgical HNSCC specimens was performed. A, IHC staining positive for AKT3 in tumor cells; left, ×100 magnification, scale bar 200 μm; right, ×200 magnification, scale bar 100 μm. B, Kaplan‐Meier survival curves based on AKT3 staining scores in tumor cells. C, Relationship between IHC staining of stromal cells and AKT3 score in tumor cells. The αSMA grades represent the infiltration of the CAFs. D, IHC staining positive for PIK3CA in tumor cells; ×100 magnification, scale bar 400 μm; right, ×200 magnification, scale bar 200 μm. E, Kaplan‐Meier survival curves based on PIK3CA staining scores in tumor cells. F, Relationship between IHC staining of stromal cells and PIK3CA score in tumor cells. αSMA, α‐smooth muscle actin; CAFs, cancer‐associated fibroblasts; HNSCC, head and neck squamous cell carcinoma
