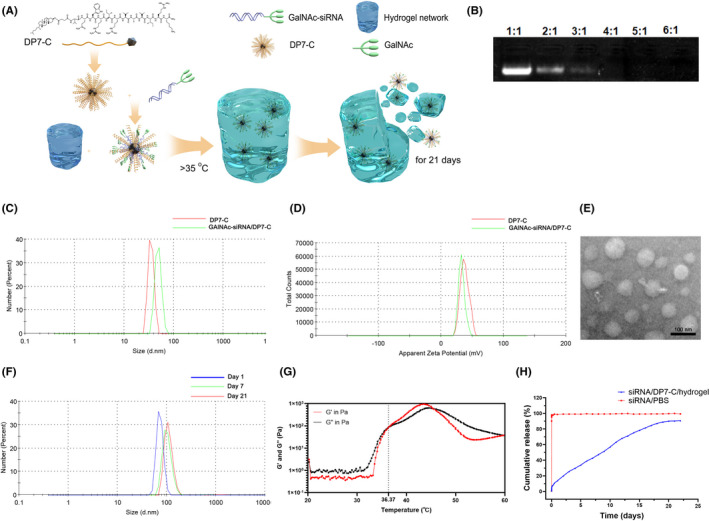
FIGURE 1.

The characterization of DP7‐C and hydrogel. A, Schematic diagram. B, Gel retardation analysis. C, D, Particle size and zeta potential distributions of DP7‐C and the GalNAc‐siRNA/DP7‐C complexes. E, The morphology of GalNAc‐siRNA/DP7‐C complexes was evaluated by TEM. Scale bar, 50 nm. F, The stability of GAlNAc‐siRNA/DP7‐C. G, Temperature dependence curves of storage modulus (G′) and loss modulus (G″) of copolymer aqueous solution (20%). H, Study on drug release properties of hydrogel
