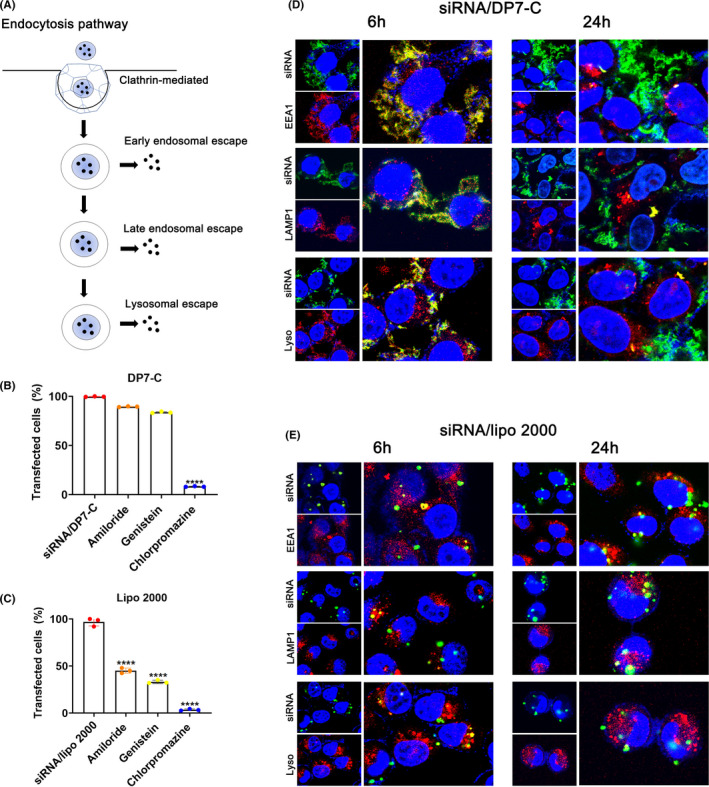
FIGURE 3.

The pathway of GalNAc‐siRNA/DP7‐C uptake and the escape process after internalization of GalNAc‐siRNA/DP7‐C in Hep3B cells. A, Schematic diagram of cellular uptake and endosomal escape. B, Uptake pathway inhibitor experiments of DP7‐C. C, Uptake pathway inhibitor experiments of Lipo2000. D, E, Hep3B cells were stained with EEA1 (red, left panels), LAMP1 (red) and lysosome (red, left panels). Blue represents the localization of the DAPI‐stained nuclei, and yellow indicates the colocalization of siRNA and endosomes. Data are expressed as the mean ± SEM. **** P < .0001
