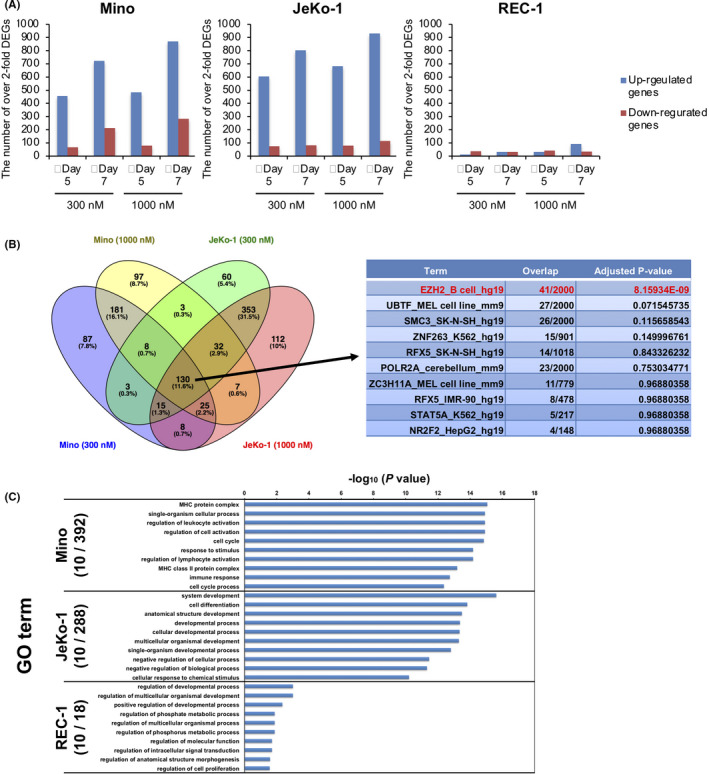
FIGURE 2.

A, The number of over‐2‐fold differentially expressed genes (DEGs) in each of the mantle cell lymphoma (MCL) cell lines on day 5 and day 7 after treatment with 300 nmol/L or 1000 nmol/L OR‐S1. RNA‐seq data were deposited in GEO (GEO accession: GSE123518). B, Candidate genes directly related to sensitivity to OR‐S1. The left Venn diagram represents the number of overlapping DEGs in 300 nmol/L and 1000 nmol/L OR‐S1–treated Mino and JeKo‐1 on day 5. The right table shows Enrichr analysis of the ENCODE ChIP‐seq database using 130 common DEGs in all samples. C, The top 10 gene ontology (GO) analysis terms in which over‐2‐fold DEGs are enriched in each of the MCL cell lines on day 5 of treatment with 300 nmol/L OR‐S1. The enriched GO terms obtained from GO analysis and corresponding P‐values are visualized as a bar graph
