FIGURE 3.

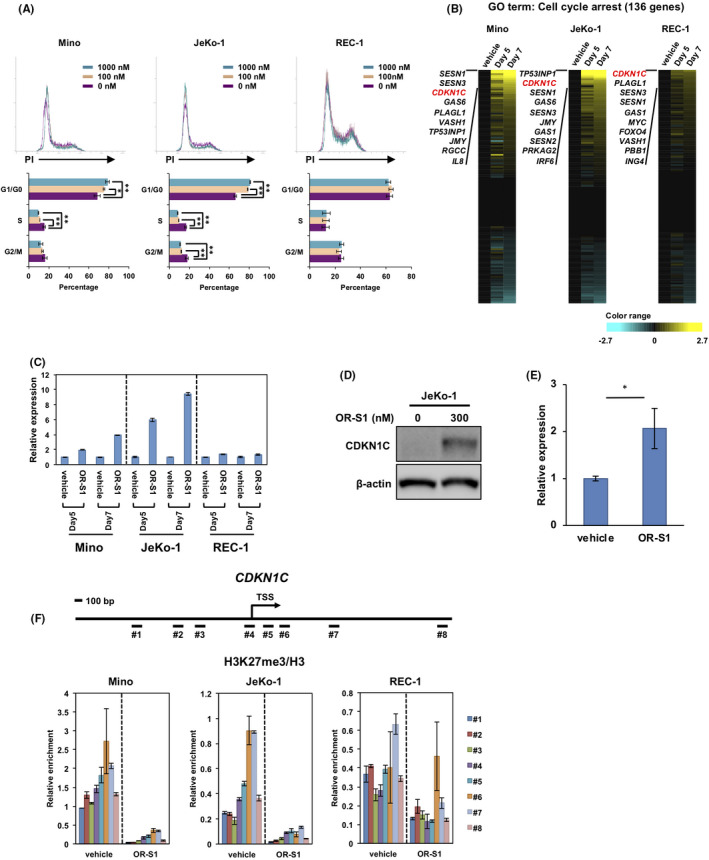
Treatment of OR‐S1 induces cell cycle arrest in mantle cell lymphoma (MCL) cells. A, Propidium iodide (PI) staining for cell cycle analysis. Cells were treated with vehicle alone or OR‐S1 (100 nmol/L or 1000 nmol/L) for 4 d. Representative flow cytometric analyses (upper panel) are shown of three independent experiments, and histogram data (lower panel) represent the mean percentage of cells ± SD in each cell cycle phase. *P < .05, **P < .01. B, Heat map represents log‐transformed relative expression values of 136 genes associated with the gene ontology (GO) term “cell cycle arrest” in three MCL cell lines treated with vehicle alone or 300 nmol/L OR‐S1 for 5 and 7 d. Yellow indicates upregulation and blue indicates downregulation of gene expression. C, Quantitative PCR validation of the CDKN1C expression found by RNA‐seq. Cells were treated with vehicle alone or 300 nmol/L OR‐S1. CDKN1C expression levels were normalized to GAPDH expression, and the relative expression level of each vehicle control–treated MCL cell line was defined as 1. Data represent the mean of triplicates ± SD. D, Protein expression of CDKN1C evaluated by Western blotting. Lysates were obtained from vehicle control– or 300 nmol/L OR‐S1–treated JeKo‐1. β‐actin was used as a loading control. E, Quantitative PCR for the expression of CDKN1C in MCL patient–derived xenograft (PDX) tumors. Tumors were obtained from mice treated with vehicle control or OR‐S1 (n = 3), and total RNA was purified. Relative CDKN1C expression was calculated as the ratio of CDKN1C to GAPDH expression. Data represent the mean of triplicates ± SD. F, ChIP assay at the CDKN1C locus. Fragmented DNAs (#1‐#8) were obtained from vehicle control– or 300 nmol/L OR‐S1–treated MCL cell lines. The levels of H3 lysine 27 trimethylation (H3K27me3) were normalized to total H3. Data represent the mean of triplicates ± SD
