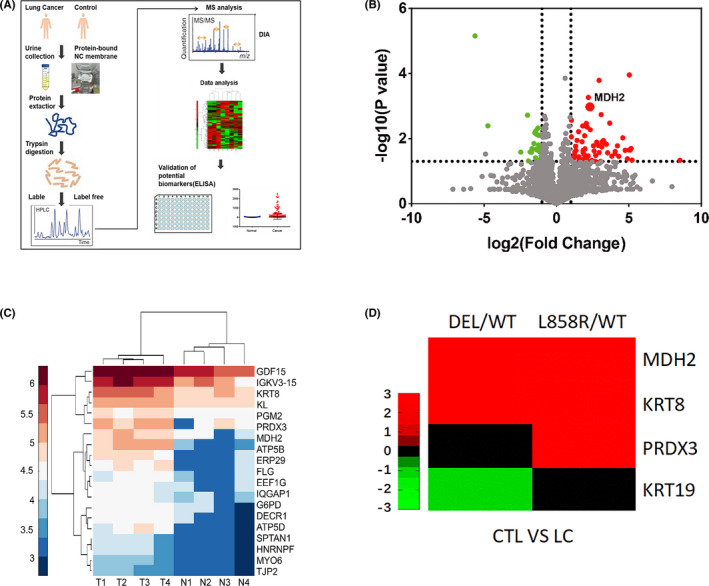
FIGURE 1.

High urinary MDH2 levels were determined using DIA MS both in patients with NSCLC and lung cancer model mice. A, Schematic of discovery and assessment of lung cancer urinary biomarkers. B, Volcano plot of urine quantitative proteome results when comparing patients with lung cancer and healthy controls. Red dots show upregulated expression and green dots show downregulated expression in cancer. C, Heat map shows the top 20 most significantly upregulated urine proteins (fold change >2, P <.05) between patients with lung cancer (represented by T1‐T4) and healthy controls (represented by N1‐N4). D, Heat map shows the top 4 highly regulated urine proteins between EGFRL858R‐driven and EGFR19DEL‐driven lung cancer model mice and wild‐type mice, which were consistent with those in human (fold change >2, P <.05). CTL, controls; WT, wild‐type mice
