
FIGURE 6.
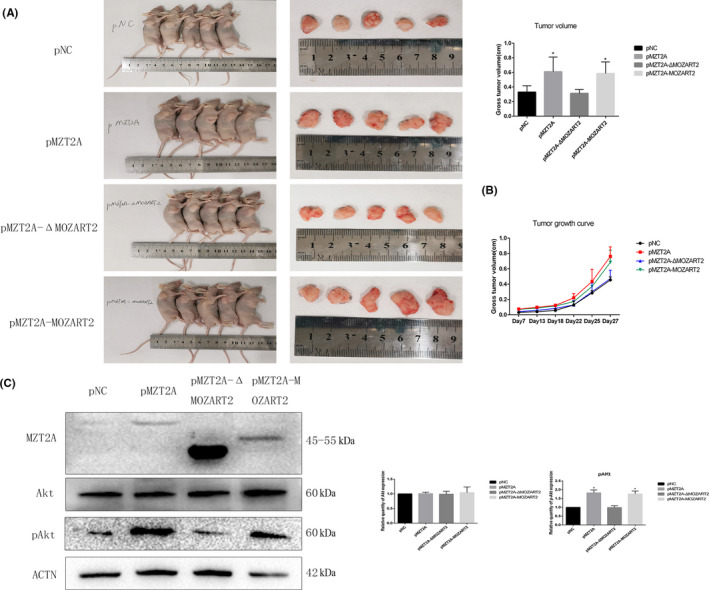
MZT2A activation of Akt phosphorylation in vivo. A, Nude mice bearing tumors (shown in the graph; P < .05). B, Tumor growth curve. Tumor size were measured at 7, 13, 18, 22, 25, and 27 d after injection. C, Western blot. Tumor proteins subjected to western blot analysis