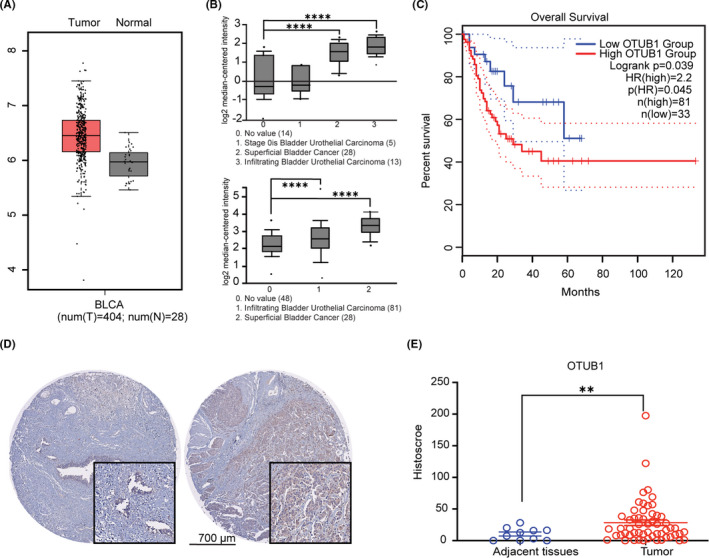
FIGURE 1.

OTUB1 expression in bladder cancer. A, OTUB1 expression in bladder urothelial carcinoma tissues compared with normal tissues on the GEPIA website. B, OTUB1 expression in bladder urothelial carcinoma, superficial bladder cancer, and infiltrating bladder urothelial carcinoma tissues compared with normal tissues on the Oncomine website. C, GEPIA survival analysis of overall survival for 114 bladder cancer samples and OTUB1 expression. The high OTUB1 group showed significantly lower survival rates (P = 0.039). D, Immunohistochemical staining of OTUB1 on tissue microarrays containing ovarian cancer and normal tissues. E, Tissue microarray data analysis of OTUB1 expression in tumor (n = 70) and adjacent normal (n = 10) tissues from 70 patients with bladder cancer (P<.01). Data are presented as the mean ± SEM. Statistical significance was analyzed by ANOVA or Student t test. *P < .05, **P < .01, ****P < .0001
