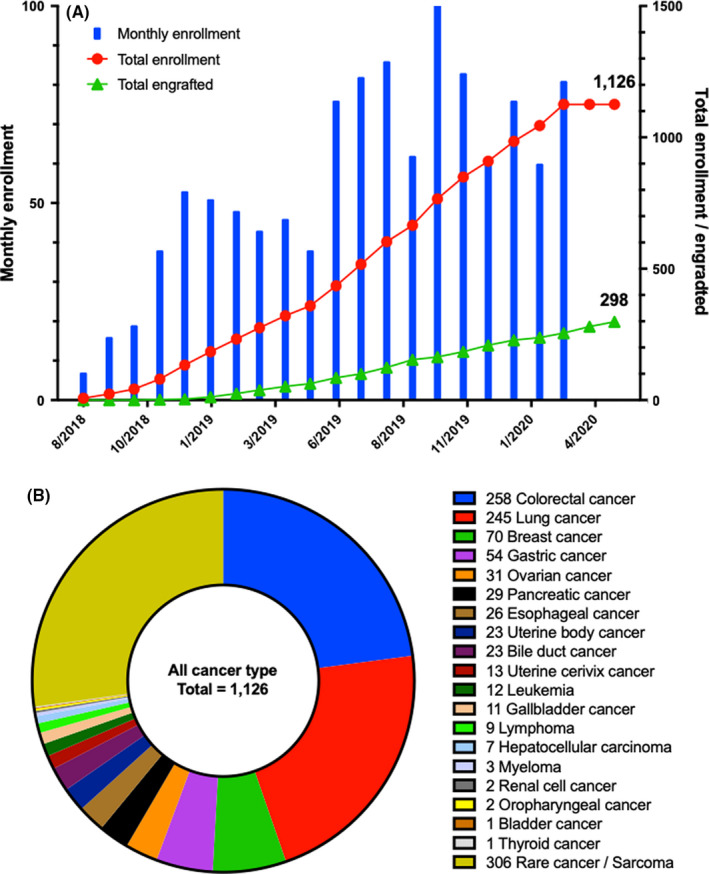
FIGURE 1.

Enrollment progress and enrolled cancer types. A, Graph depicting the enrollment progress from August 22, 2018 to May 31, 2020. Blue bars indicate the number of enrollments per month, red lines indicate the total number of enrollments, and green lines indicate the total number of engrafted PDXs. As of May 31, 2020, there were a total of 1126 cases enrolled and 298 engrafted. B, The breakdown of enrolled cases by cancer type. A breakdown of rare cancers is shown in Figure S2
