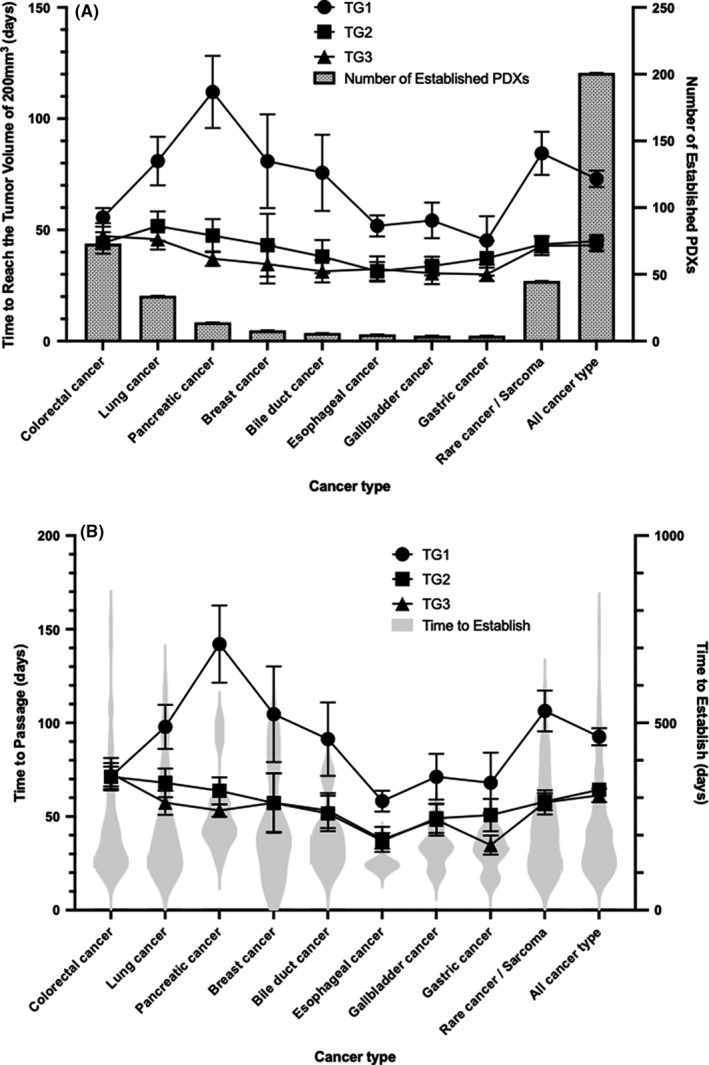
FIGURE 2.

Time to reach tumor volume of 200 mm3 and time to passage. A, Time to reach tumor volume of 200 mm3 by cancer type. Only carcinomas that have been established in more than two PDXs are indicated. The line graph shows the number of days in each passage (TG1, 2, 3) and corresponds to the left y‐axis. The bars show the number of PDXs established for each carcinoma and correspond to the y‐axis on the right. B, Time to passage by cancer type. The line graph shows the number of days in each passage (TG1, 2, 3) and corresponds to the left y‐axis. The violin plot shows the time to establishment and corresponds to the right y‐axis
