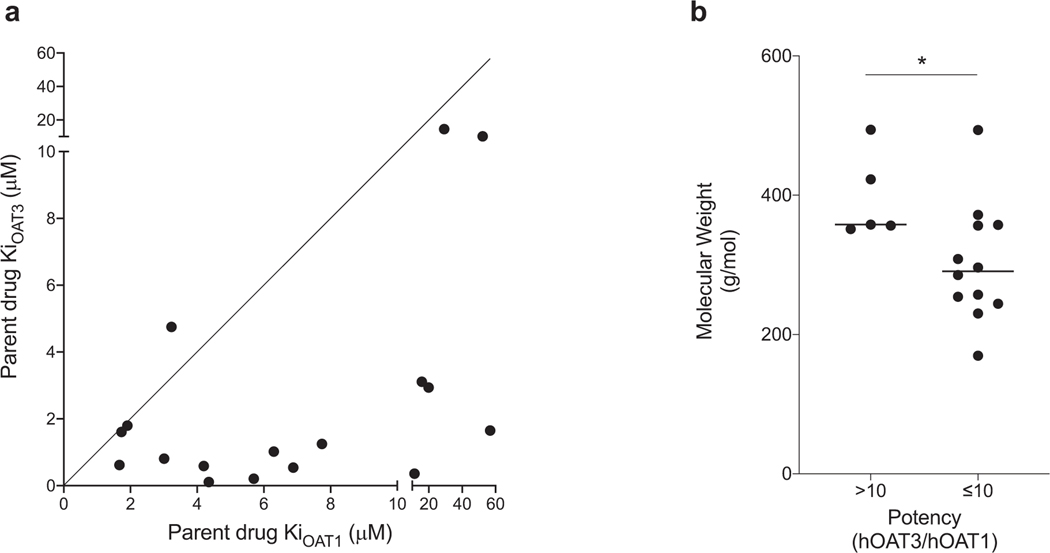
Fig. 3.
Comparison of inhibition potency of parent drugs for OAT1 and OAT3. (a) The Ki values of 17 drugs for both OAT1 and OAT3 were plotted. Each dot represents Ki values of each unique drug. The line was forced through x = 0 and y = 0 with the angle of 45° (indicating a slope of 1). The further a point is away from the line, the more different between the Ki values for OAT1 and OAT3. Two drugs were not shown in the plot because they are not inhibitors of OAT1 and OAT3, including celecoxib and abiraterone. (b) Comparison of molecular weight of parent drugs showing >10-fold inhibition potency ratio (OAT3/OAT1) with molecular weight of parent drugs showing ≤ 10-fold inhibition potency ratio. *p < 0.05 (student’s unpaired t-test).

