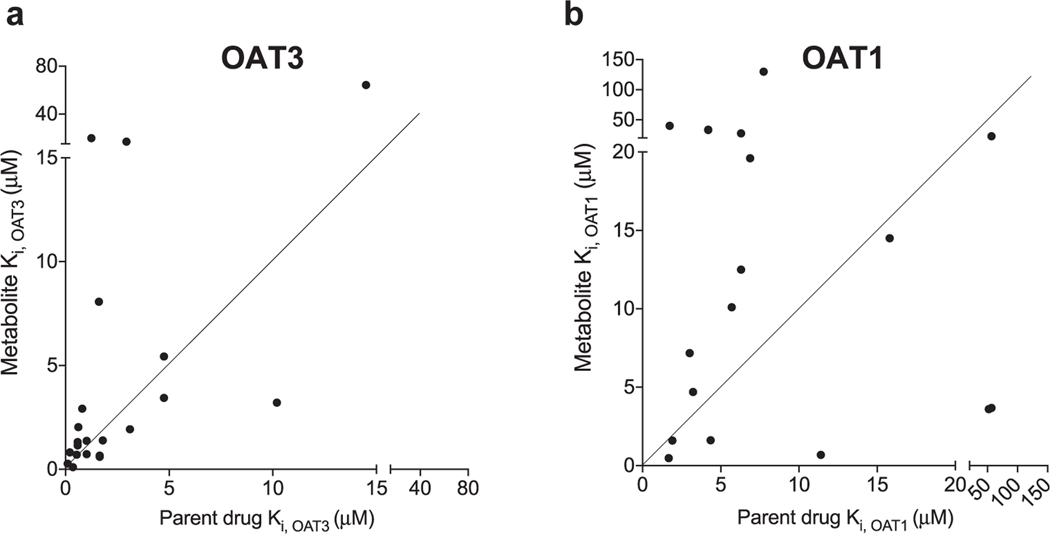
Fig. 4.
Correlation of Ki values between parent drugs and drug metabolites for OAT3 (A) and OAT1 (B). For both (a) and (b) each point represents a pair of drug and drug metabolite with the parent drug Ki value showing on the x-axis and the drug metabolite Ki value showing on the y-axis. The line was forced through x = 0 and y = 0 with the angle of 45° consistent with a slope of 1. The further a dot is away from the line, the more different between the Ki values of a parent drug and the corresponding drug metabolite.

