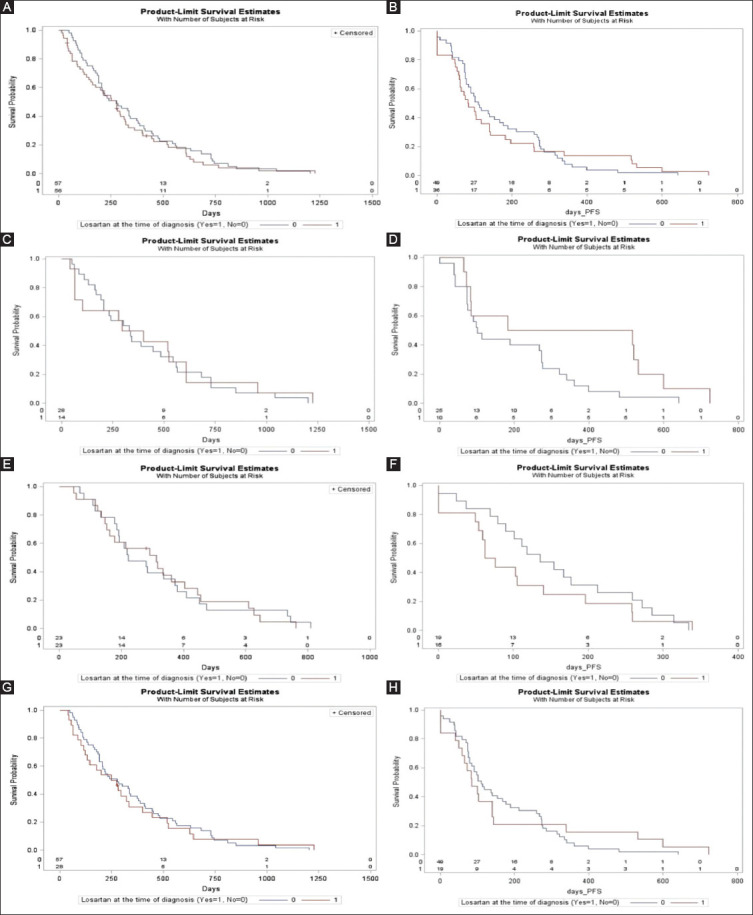
Figure 1. (A) Survival curve comparison of overall survival (OS) of losartan versus control groups. (B) Survival curve comparison of progression-free survival (PFS) of losartan versus control groups; (C) survival curve comparison of OS of FOLFIRINOX losartan versus FOLFIRINOX control groups; (D) survival curve comparison of PFS of FOLFIRINOX losartan versus FOLFIRINOX control groups; (E) survival curve comparison of OS of gemcitabine+abraxane losartan versus gemcitabine + Abraxane control groups; (F) survival curve comparison of OS of gemcitabine + Abraxane losartan versus gemcitabine + Abraxane control groups; (G) survival curve comparison of OS of 100 mg losartan versus control groups; (H) Survival curve comparison of PFS of 100 mg losartan versus control groups.

