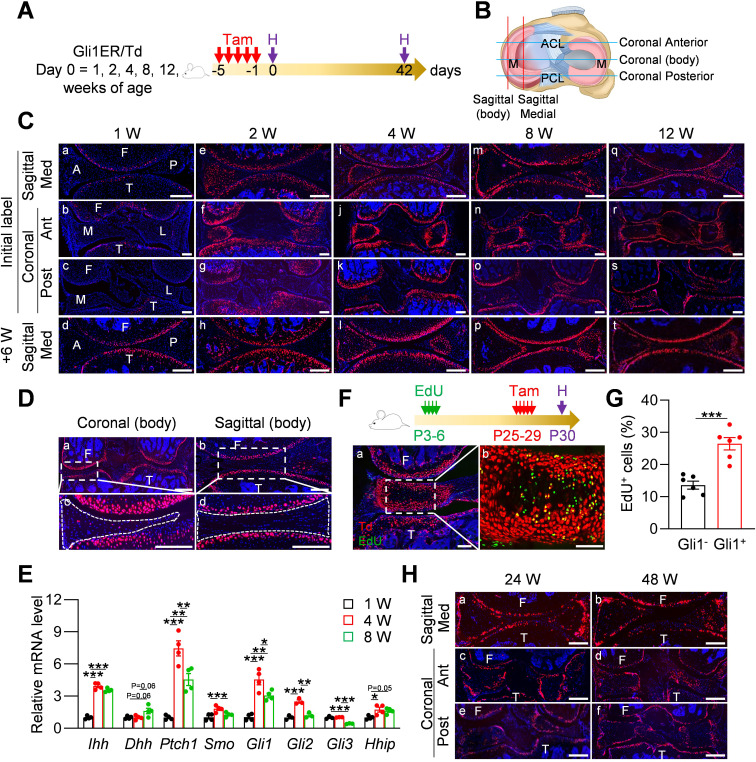
Figure 1. Gli1 labels mesenchymal progenitors in mouse meniscus during development.
(A) Schematic graph of the study protocol. Male Gli1ER/Td mice were treated with Tam at 1, 2, 4, 8, and 12 weeks of age and analyzed at 24 hr (pulse) or 6 weeks (tracing) after the last Tam dosing. (B) Schematic cartoon of meniscus shows sectioning sites. M: meniscus; ACL: anterior cruciate ligament; PCL: posterior cruciate ligament. (C) Representative fluorescence images of meniscus sections at indicated ages and sectioning sites. n = 3 mice/age/sectioning site. Scale bars, 200 μm. F: femur; T: tibia; A: anterior; P: posterior; M: medial meniscus; L: lateral meniscus; Med: medial; Ant: anterior; Post: posterior. Red: Td; Blue: DAPI. (D) Representative fluorescence images of meniscus body at coronal (a) and sagittal (b) planes from 12-week-old Gli1ER/Td mice. Meniscus were harvested at 24 hr after the last Tam injection. n = 3 mice/sectioning site. Scale bars, 200 μm. Boxed areas in a and b are shown at high magnification as c and d, respectively. Dashed lines outline meniscus. (E) qRT-PCR analysis of Hh signaling component genes in mouse meniscus tissues at 1, 4, 8 weeks of age. n = 4 independent experiments. (F) Top panel is a schematic representation of the study protocol. Gli1ER/Td mice were injected with EdU at P3-6 and Tam at P25-29. Joints were harvested 24 hr later. Representative confocal images of coronal sections of mouse knee joints are presented at the bottom panel. Boxed area in a (Scale bars, 200 μm) is shown at high magnification in b (Scale bars, 50 μm). Green: EdU. (G) The percentage of EdU+ cells within Gli1+ or Gli1- meniscus cells was quantified. n = 6 mice/group. (H) Gli1ER/Td mice were treated with Tam at 24 or 48 weeks of age and analyzed 24 hr later. Representative fluorescence images of sagittal (a, b) and coronal (c–f) sections of knee joints are presented. Scale bars, 200 μm. Statistical analysis was performed using unpaired two-tailed t-test and one-way ANOVA with Tukey-Kramer post-hoc test. Data presented as mean ± s.e.m. *p<0.05, **p<0.01, ***p<0.001.


