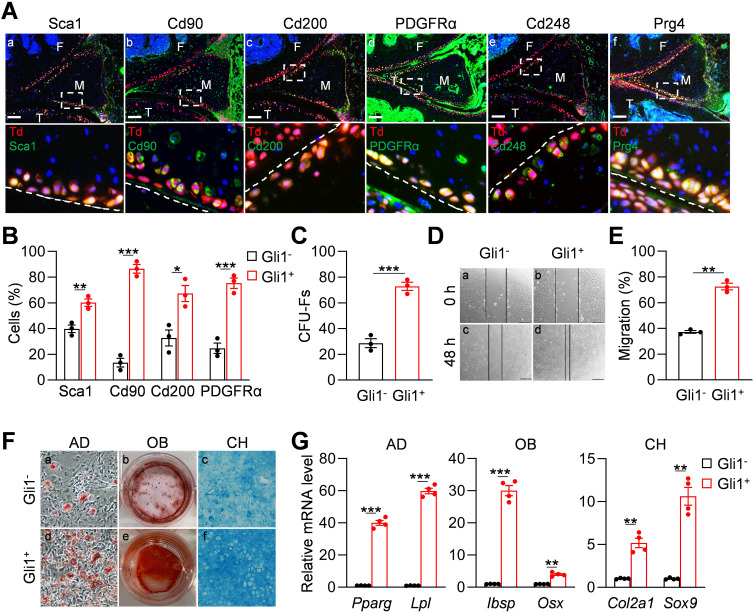
Figure 2. Gli1-labeled meniscus cells possess mesenchymal progenitor properties.
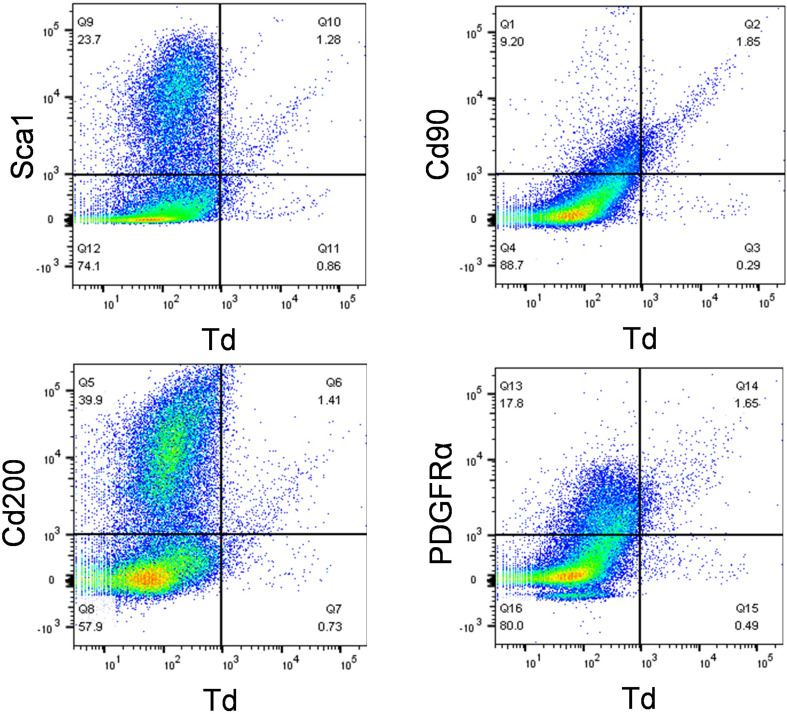
(A) Representative immunofluorescence images of Sca1, Cd90, Cd200, PDGFRα, Cd248, and Prg4 staining in 3-month-old Gli1ER/Td meniscus. Scale bars, 200 μm. Boxed areas are shown at high magnification in corresponding panels at the bottom. Dashed lines indicate meniscus surface. Yellow cells are double positive for progenitor marker and Td. F: femur; T: tibia; M: meniscus. Blue: DAPI. (B) Quantification of the expression level of mesenchymal progenitor markers in Gli1+ and Gli1- cells from meniscus. Digested meniscus cells from 3-month-old Gli1ER/Td mice were subjected to flow cytometry analysis. n = 3 independent experiments. (C) CFU-F assay of digested meniscus cells. Td+colonies and Td- colonies were counted from 1 × 10⁴ seeded cells. n = 3 independent experiments. (D) Representative bright-field images of the scratch-wound closure in Gli1+ or Gli1- meniscus cells at 0 and 48 hr. Scale bars, 200 μm. Solid lines indicate the remaining area not covered by meniscus cells. (E) The relative migration rate was measured by the percentage of scratched area being covered by migrated cells at 48 hr. n = 3 independent experiments. (F) Representative adipogenic (AD), osteogenic (OB), and chondrogenic (CH) differentiation images of Gli1+ and Gli1- cells. Cells were stained by Oil Red, Alizarin red, and Alcian blue, respectively. (G) qRT-PCR analysis of lineage markers in Gli1- or Gli1+meniscal cells after being cultured in adipogenic, osteogenic and chondrogenic differentiation media for 1, 2, and 3 weeks, respectively. n = 4 independent experiments. Statistical analysis was performed using unpaired two-tailed t-test. Data presented as mean ± s.e.m. *p<0.05, **p<0.01, ***p<0.001.


