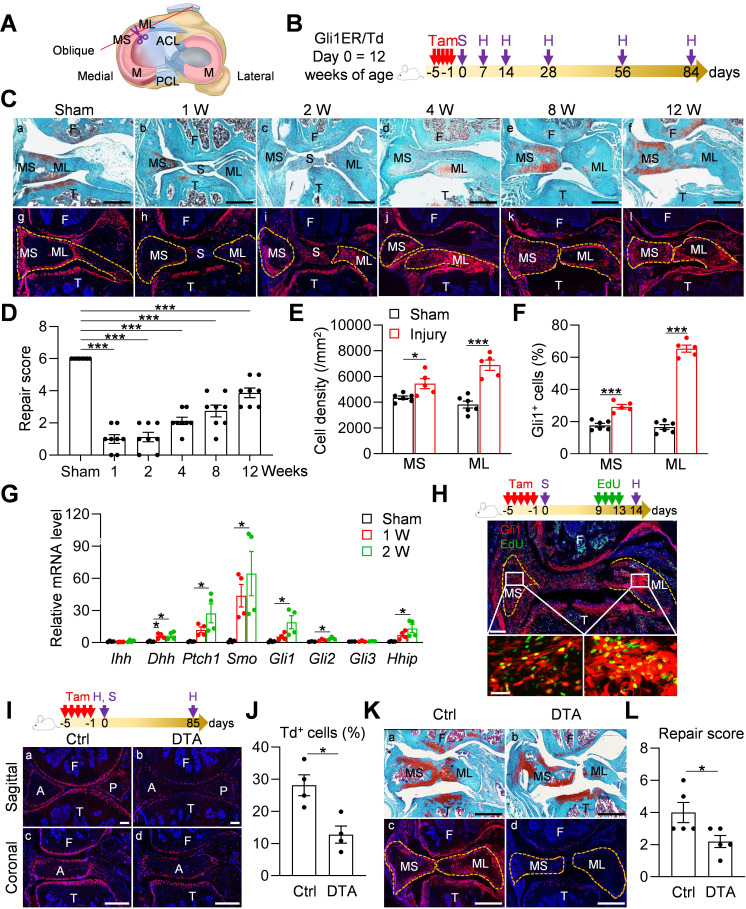
Figure 4. Meniscus injury rapidly expands Gli1-lineage cells.
(A) Schematic cartoon of meniscus shows the sectioning site. M: meniscus; MS: meniscus synovial end; ML: meniscus ligamental end. A pair of scissors indicates the transection site. ACL: anterior cruciate ligament; PCL: posterior cruciate ligament. (B) Male Gli1ER/Td mice received Tam injections (day −5 ~ −1) and meniscus injury (day 0) at 12 weeks of age. Knee joints were harvested at 1, 2, 4, 8, 12 weeks after injury. (C) Representative safranin O/fast green staining (top) and fluorescence images (bottom) of oblique sections of mouse knee joints harvested at indicated time points after injury. Dashed lines outline the meniscus. Scale bars, 200 μm. F: femur; T: tibia; S: synovium; MS: meniscus synovial end; ML: meniscus ligamental end. Red: Td; Blue: DAPI. (D) Repair score was evaluated at indicated time points after meniscus injury. n = 8 mice/group. (E) Cell density in the synovial and ligamental ends of meniscus was quantified at 4 weeks post meniscus injury. n = 5–6 mice/group. (F) The percentage of Td+ cells in the synovial and ligamental ends of meniscus was also quantified. n = 5–6 mice/group. (G) qRT-PCR analysis of Hh signaling component genes in meniscus at 1 and 2 weeks post injury. n = 4 independent experiments. (H) Top panel is a schematic representation of the study protocol. Gli1ER/Td mice at 12 weeks of age were treated with Tam (day −5 to −1), meniscus injury (day 0), and EdU injections (day 9–13). A representative confocal image of knee joint at day 14 is shown below (Scale bars, 250 μm). Boxed areas of synovial and ligamental ends of meniscus (MS and ML, respectively) are shown at high magnification at the bottom (Scale bar, 25 μm). Green: EdU. (I) Top panel is a schematic representation of the study protocol. Gli1ER/Td (Ctrl) or Gli1ER/Td/DTA (DTA) mice were treated with Tam (day −5 to −1) and meniscus injury at 12 weeks of age (day 0). Representative fluorescent images of sagittal and coronal mouse knee joint sections at day 0 without injury are shown below (Scale bars, 200 μm). A: anterior; P: posterior. (J) The percentage of Td+ cells in the anterior horn was quantified. n = 4 mice/group. (K) Representative safranin O/fast green staining (a, b) and fluorescence images (c, d) of oblique sections of mouse knee joints harvested at 12 weeks after injury. Dashed lines outline the meniscus. Scale bars, 200 μm. (L) Repair score was evaluated. n = 5 mice/group. Statistical analysis was performed using one-way ANOVA with Dunnett’s post-hoc test for (D), one-way ANOVA with Tukey-Kramer post-hoc test for (G) and unpaired two-tailed t-test for (E), (F), (J) and (L). Data presented as mean ± s.e.m. *p<0.05, ***p<0.001.


