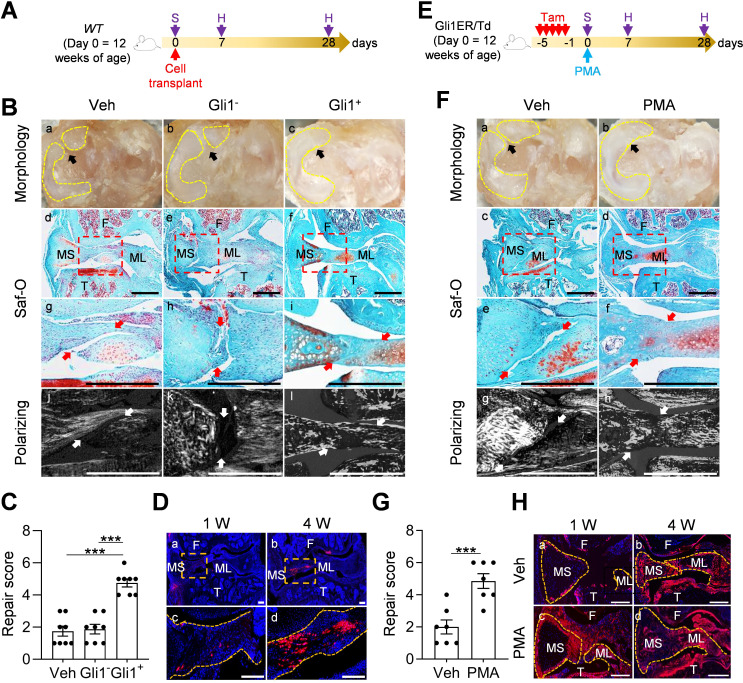
Figure 5. Activation of Hh/Gli1 pathway accelerates mouse meniscus repair.
(A) Schematic representation of the study protocol. WT mice received meniscus injury at 12 weeks of age followed by transplantation of 5000 Gli1+ or Gli1- meniscus cells at the injury site. Knee joints were harvested at 1 and 4 weeks after injury. (B) Representative overview (a–c), safranin O/fast green staining (d–i), and polarizing images (j–l) of mouse knee joints at 4 weeks after injury. Yellow dashed lines outline the overview morphology of injured meniscus. Meniscus is shown attached to tibial plateau. Arrows point to the injury site. Red boxed areas in d-f are shown at high magnification in g-i, respectively. Scale bars, 200 μm. F: femur; T: tibia; MS: meniscus synovial end; ML: meniscus ligamental end. (C) Repair score was evaluated. n = 8 mice/group. (D) Representative confocal images of mouse knee joints at 1 and 4 weeks after injury. Boxed areas in the top panel are shown at a high magnification at the bottom panel. Dashed line outlines meniscus. Scale bars, 200 μm. Blue: DAPI, Red: Td. (E) Schematic representation of the study protocol. Gli1ER/Td mice received Tam injections and meniscus injury at 12 weeks of age (day 0) followed by vehicle and PMA injection. Knee joints were harvested at 1 and 4 weeks after injury. (F) Representative overview (a, b), safranin O/fast green staining (c–f), and polarizing images (g, h) of mouse knee joints at 4 weeks after injury. Yellow dashed lines outline the overview morphology of injured meniscus. Meniscus is shown attached to tibial plateau. Red boxed areas in c and d are shown at high magnification in e and f, respectively. Arrows point to the injury site. Scale bars, 200 μm. (G) Repair score was evaluated. n = 7 mice/group. (H) Representative fluorescence images of vehicle- and PMA-treated mouse meniscus at 1 and 4 weeks after injury. Scale bars, 200 μm. Statistical analysis was performed using one-way ANOVA with Tukey-Kramer post-hoc test for (C) and unpaired two-tailed t-test for (G). Data presented as mean ± s.e.m. ***p<0.001.


