. 2021 Jun 4;10:e65745. doi: 10.7554/eLife.65745

Figure 2. Reconstruction of the Drosophila larval ring gland and RPNs.

(A) Upper panel: 3D reconstructed RG areas in dorsal and lateral view (CC = orange, PG = green, CA = blue, AO = pink). Cross section of the AO: colored areas represent single neurites of different CC cells. Middle panel: dorsal and lateral view of the RG showing the different cells in the distinct RG areas (CC, CA, and PG). Lower panel: neurites innervating the RG areas were separated based on innervation of the CC and aorta, only CA or only PG. Fused DCVs are marked as red dots. (B) Schematic of all 56 neurons innervating the RG named by the main neuropeptide produced. Total number of neurons per RPN cluster: DMS = 4, IPCs = 14, DH44 = 6, CRZ = 6, ITP = 8, CA-LP = 6, PTTH = 4, HugRG = 4, CAPA = 2, EH = 2. For clarity, only one side is shown for each neuronal cluster. (C) Left: reconstructed CRZ. Fused DCVs were marked as non-polar output synapses at distal neurites in RG tissues (red dots). Blue dots represent chemical synaptic input sites. Right: example picture of a DCV fusion site in the EM volume (DCV has to be fused to the membrane). (D) Left: magnification of the reconstructed RG with spatial distribution of CRZ DCV fusion sites (red dots).Right: quantification of all DCV fusion sites found in the RG areas for each RPN group. Numbers in brackets are total numbers of marked DCVs. The X-axis represents a fraction of fused DCVs. (E) Left: synaptic outputs of all RPNs (threshold = 3 synapses) constitute in total 30 neurons, which are exclusively downstream of EH RPNs. Right: spatial distribution of presynaptic sites of EH. EH neurons are the only RPNs having presynaptic sites located along abdominal, thoracic segments, and SEZ and protocerebrum. (F) EH neurons synaptically target other RPNs. Percentage represents the fraction of input of distinct RPNs from EH neurons, for example, ITP neurons receive 5% of its inputs from EH. a: anterior; AO: aorta; CA: corpus allatum; CA-LP: corpus allatum innervating neurosecretory neurons of the lateral protocerebrum; CAPA: capability neurons; CC: corpora cardiaca; CRZ: corazonin neurons; DCVs: dense core vesicles; DH44: diuretic hormone 44 neurons; DMS: Drosophila myosuppressin neurons; EH: eclosion hormone neurons; HugRG: Hugin neurons innervating ring gland; IPCs: insulin-producing cells; ITP: ion transport peptide neurons; p: posterior; PG: prothoracic gland; PTTH: prothoracicotropic hormone neurons; RG: ring gland; RPN: ring gland projection neurons; SEZ: subesophageal zone; ssTEM: serial section transmission electron microscope.

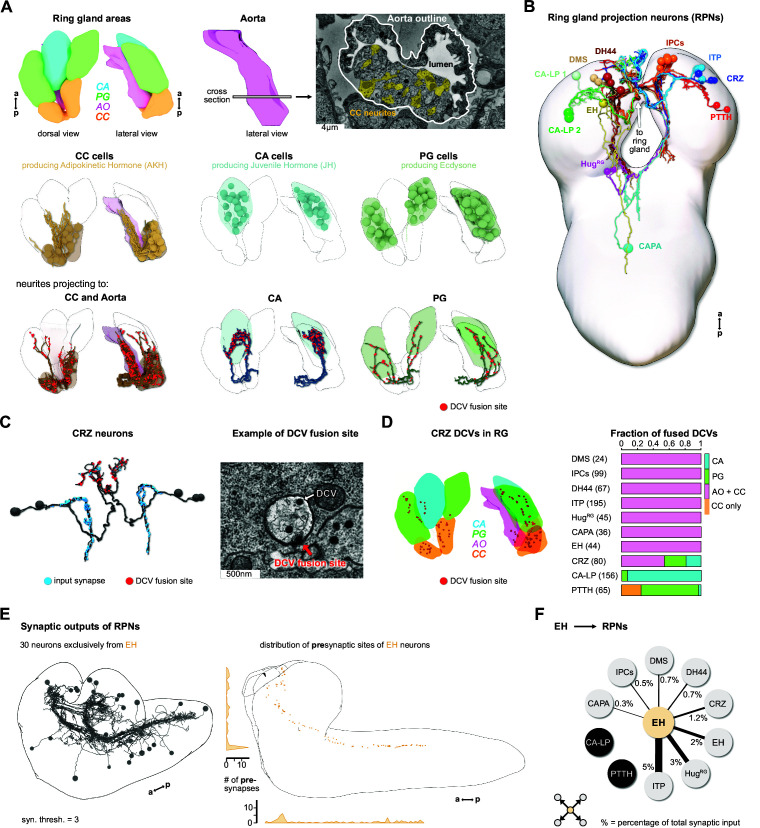
Figure 2—source data 1. Comprehensive overview of all Drosophila RPN clusters.

Figure 2.

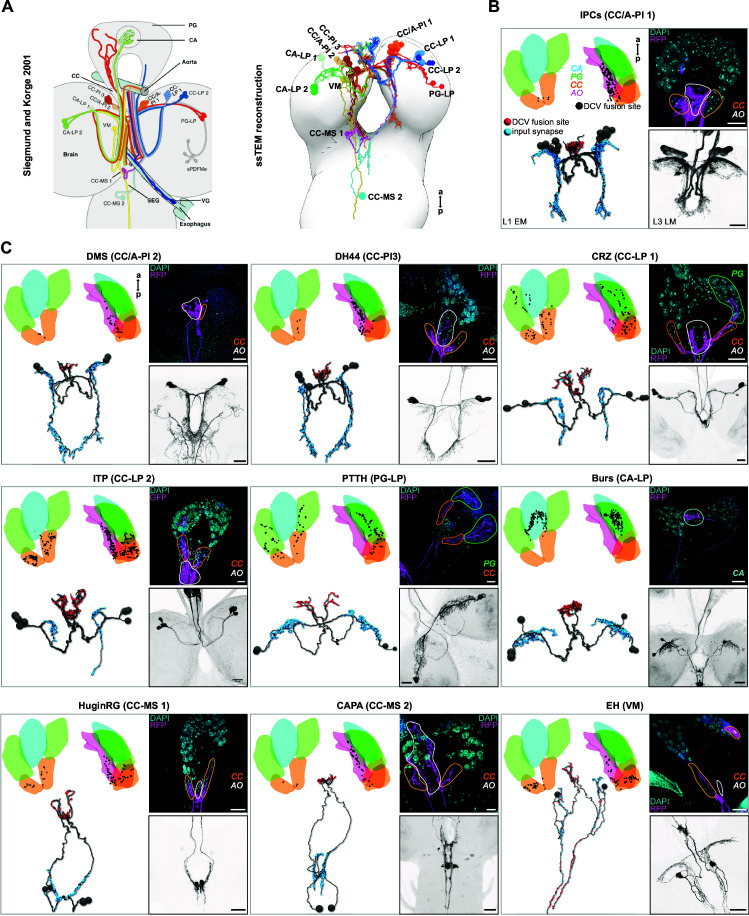
Figure 2—figure supplement 1. Neurons projecting to the ring gland in Drosophila larvae.

Figure 2—figure supplement 1.

(A) All RPNs could be re-identified by comparing the neurons innervating the ring gland previously published by Siegmund and Korge, 2001 to all RPNs found in the ssTEM volume (right panel). (B, C) DCV fusion sites were analyzed (black dots in dorsal and lateral view of the ring gland) in the ssTEM dataset (upper left part of each panel). Lower left part of each panel: blue dots represent chemical postsynapses in the brain and red dots represent DCV fusion sites in the RG. Note that presynapses for EH neurons are also found in the CNS (red dots). RPNs identified in the ssTEM volume were compared to respective expression patterns of Gal4/LexA lines in fluorescence stainings (RFP/GFP, right side of each panel). Upper right of each panel displays Gal4/LexA-driven expression patterns of RFP or GFP in the ring gland co-stained with DAPI to visualize RG areas. CA-LP neurons were visualized using a Bursicon-Gal4 line. Expression in the CA has not been reported yet for Bursicon. Note that ssTEM volume was generated from a first instar larva (L1 EM), whereas fluorescence staining/light microscopy was carried out in third instar larvae (L3 LM). For all genotypes, see Material and methods section. All scale bars represent 20 µm, except scale bar in CAPA analysis (10 µm). a: anterior; AO: aorta; Burs: bursicon neurons; CA: corpus allatum; CA-LP: corpus allatum innervating neurosecretory neurons of the lateral protocerebrum; CAPA: capability neurons; CC: corpora cardiaca; CC‐LP: corpora cardiaca innervating neurosecretory neurons of the lateral protocerebrum; CC‐MS: corpora cardiaca innervating neurosecretory neurons of the medial subesophageal ganglion; CC‐PI: corpora cardiaca innervating neurosecretory neurons of the pars intercerebralis; CC/A‐PI: corpora cardiaca and aorta innervating neurosecretory neurons of the pars intercerebralis; CRZ: corazonin neurons; DAPI: 4′,6-diamidino-2-phenylindole; DCVs: dense core vesicles; DH44: diuretic hormone 44 neurons; DMS: Drosophila myosuppressin neurons; EH: eclosion hormone neurons; GFP: green fluorescent protein; HuginRG: hugin neurons innervating ring gland; IPCs: insulin-producing cells; ITP: ion transport peptide neurons; p: posterior; PG: prothoracic gland; PG‐LP: prothoracic gland innervating neurosecretory neurons of the lateral protocerebrum; PTTH: prothoracicotropic hormone neurons; RFP: red fluorescent protein; RG: ring gland; RPNs: ring gland projection neurons; SEG: subesophageal ganglion; sPDFMe: small pigment dispersing factor neurons in the medulla; ssTEM: serial section transmission electron microscope; VG: ventricular ganglion; VM: ventromedial cells.
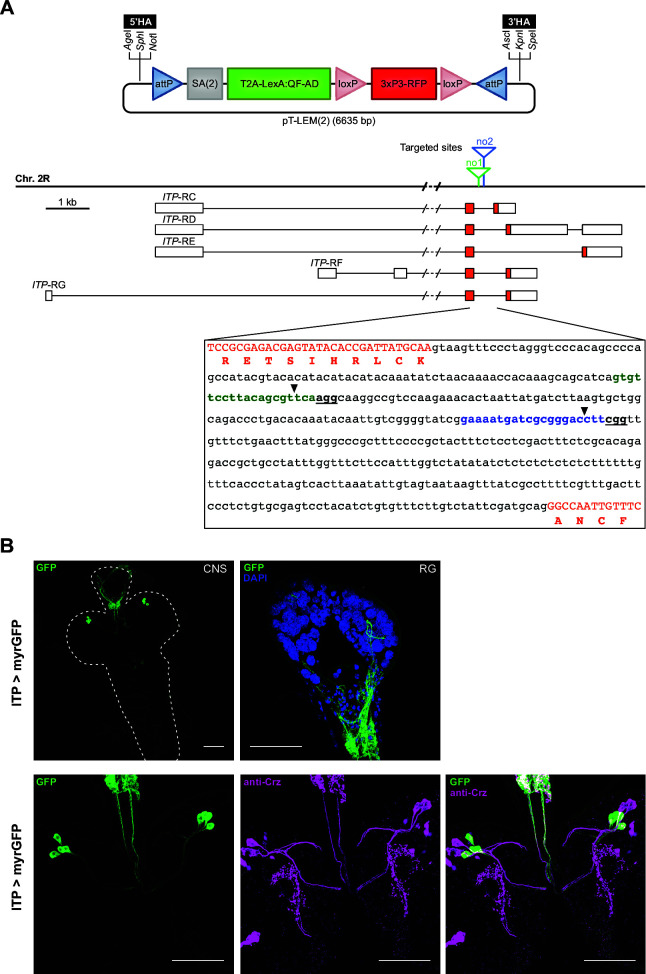
Figure 2—figure supplement 2. CRISPR/Cas-dependent integration of T-LEM cassettes into ITP intron.

Figure 2—figure supplement 2.

(A) Schematic of the T2A-LexA expression module (T-LEM) vector pT-LEM(2), which contains RFP under the control of 3xP3. Multiple cloning sites flanking T-LEM permit insertion of appropriate homology arms to target ITP intron. SA(2) in pT-LEM(2) allows integration of T-LEM as a new exon into phase two introns. Genomic locus on second chromosome with all five predicted splice variant transcripts of ITP gene depicting two intronic sites (no1, no2) targeted for T-LEM insertion. Boxes represent exons; orange areas show protein-coding regions. Sequence of ITP intron displaying protospacers no1 (green) and no2 (blue). PAMs are bold and underlined. Coding exons are capitalized and orange. One-letter code amino acid sequence is shown in orange and positioned under the first nucleotide of the encoding triplet. Black arrowheads mark target sites for T-LEM insertion. (B) Fluorescence staining of ITP-T2A-LexA line driving LexAop-myrGFP. Upper panel: expression in whole CNS and RG. Lower panel: colocalization analysis with CRZ reveals no overlap of both RPN groups. For all genotypes, see Material and methods. All scale bars represent 20 µm. 3'HA: upstream homology arm; 3xP3: synthetic eye promoter; 5'HA: downstream homology arm; AD: activating domain; attP: attachment site on the phage part; bp: base pairs; Chr. 2 R: right arm of second chromosome; CNS: central nervous system; Crz: corazonin; DAPI: 4′,6-diamidino-2-phenylindole; GFP: green fluorescent protein; ITP: ion transport peptide; ITP-RC/-RD/-RE/-RF/-RG: ITP transcript C/D/E/F/G; kb: kilo base pairs; loxP: locus of crossover in phage P1 sequence; myrGFP: myristoylated green fluorescent protein; PAM: protospacer adjacent motif; RFP: red fluorescent protein; RG: ring gland; RPNs: ring gland projection neurons; SA(2): splice acceptor sequence and intron phase two linker; T2A: 2A self-cleaving peptide from Thosea asigna virus.
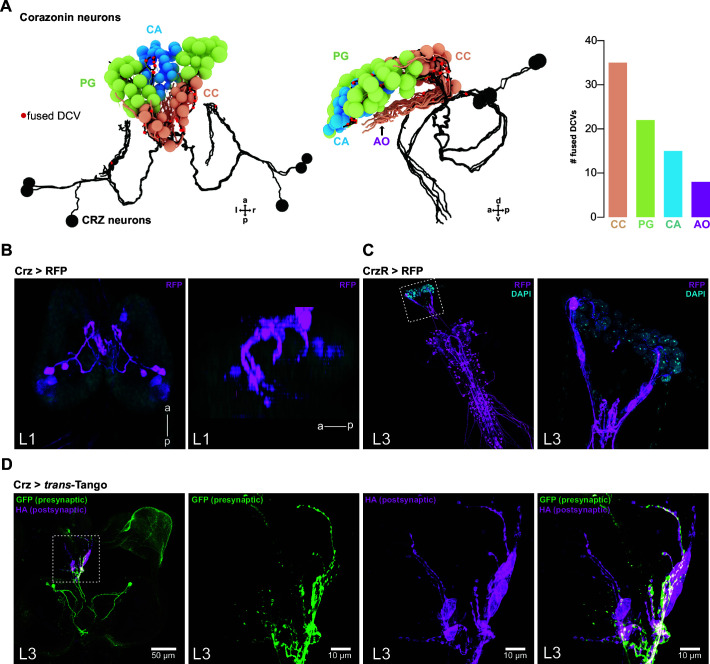
Figure 2—figure supplement 3. Fused DCV sites as proxy for real release sites in the ring gland: example CRZ.

Figure 2—figure supplement 3.

(A) Reconstructed CRZ in dorsal and lateral view with projections to RG cells (red dots are DCV fusion sites). Right bar plot shows quantification of the number of fused DCVs in CC, PG, CA, and AO. Most output release sites were found in the CC. (B) Analysis of the Crz-Gal4 line in L1 CNS shows only activity in CRZ projecting to RG. View angles are the same as in (A). (C) Analysis of CrzR in L3 CNS (left) and in RG (right) shows CrzR activity in CC cells. (D) Staining of post-'peptidergic' cells of CRZ using the trans-Tango system (note that no output synapses for CRZ were identified in ssTEM volume; whether synapses are present in L3 stage is not known). Only CC cells were marked as being postsynaptic to CRZ. For all genotypes, see Materials and methods section. a: anterior; AO: aorta; CA: corpus allatum; CC: corpora cardiaca; CRZ: corazonin neurons; Crz: corazonin (gene/peptide related); CrzR: corazonin receptor; d: dorsal; DAPI: 4′,6-diamidino-2-phenylindole; DCV: dense core vesicle; GFP: green fluorescent protein; HA: hemagglutinin tag; l: left; L1: first instar larval stage; L3: third instar larval stage; p: posterior; PG: prothoracic gland; r: right; RFP: red fluorescent protein; RG: ring gland; v: ventral.
Figure 2—figure supplement 4. Analysis of larval brain transcriptome data.

Figure 2—figure supplement 4.

(A) Cluster plot (umap) of all cell clusters derived from the larval brain transcriptome (Brunet Avalos et al., 2019). Highlighted are clusters containing peptidergic and RG-specific cells (CC, CA, and PG). (B) Graphical representation of peptide receptor interactions of CRZ other RPNs. Since CRZ are known to release additionally sNPF and proctolin, they potentially interact with RPNs having the respective receptors for these peptides. (C) Peptide receptor connectivity of all RPNs using the known expressed peptide and respective receptors. This illustrates dense lateral connections of RPNs. Average receptor expression is visualized by thickness of connections (0–5). Dot plot showing the scaled average peptide receptor expression (color code) and certain percentage of the RPN cell clusters (size of dots). (D) Peptide receptor connectivity of the RPNs to the RG areas (CC, PG, and CA). InR expression is strongest in all three tissues. Dot plot showing the scaled average peptide receptor expression (color code) and certain percentage of the distinct RG areas. Analysis was performed using a modified version of the Seurat workflow published by Satija lab (Stuart et al., 2019). For details on separation parameters of RPNs, please see Materials and methods section. avg.: average; CA: corpus allatum; CA-LP: corpus allatum innervating neurosecretory neurons of the lateral protocerebrum; CAPA: capability neurons; CapaR: capability receptor; CC: corpora cardiaca; CRZ: corazonin neurons; Crz: corazonin (gene/peptide related); CrzR: corazonin receptor; DH44: diuretic hormone 44 neurons; Dh44-R1/-R2: diuretic hormone 44 receptor 1/2; DMS: Drosophila myosuppressin neurons; EH: eclosion hormone neurons; FMRFaR: FMRFamide receptor; HugRG: hugin neurons innervating ring gland; InR: insulin-like receptor; IPCs: insulin-producing cells; ITP: ion transport peptide neurons; Lkr: leucokinin receptor; MsR1/MsR2: myosuppressin receptor 1/2; PG: prothoracic gland; PK1-R: pyrokinin one receptor; PK2-R1/-R2: pyrokinin 2 receptor 1/2; Proc: proctolin; Proc-R: proctolin receptor; PTTH: prothoracicotropic hormone neurons; RG: ring gland; rk: rickets; RPNs: ring gland projection neurons; sNPF: short neuropeptide F precursor; sNPF-R: short neuropeptide F receptor; tor: torso.
Figure 2—figure supplement 5. Thresholds for reconstruction and analysis of the RPN connectome.

Figure 2—figure supplement 5.

(A) Sensory neurons with every presynaptic site have been completely reconstructed by Miroschnikow et al., 2018. RPNs have been reconstructed completely with every postsynaptic site. Interneurons located upstream of RPNs were completely reconstructed using a synaptic threshold of 3 (to RPNs). This made it possible to reach in total 93% of all incoming synaptic connections to the RPNs. Yellow = synapses from sensory neurons; green = annotated synapses from interneurons; blue = synapse bycatch from interneurons with 1–2 synapses to respective RPN cluster (these interneurons, however, have minimum three synapses to other RPN clusters); red = synapses from unidentified upstream partners. Thus even more synapses were reconstructed in total than interneurons having three or more synapses to RPNs. (B) Upper left: shown is the percentage of synaptic connections of sensory neurons to interneurons made with a certain number of synapses. Sensory neurons make most of their connections (nearly 40% of all connections) with one synapse to an interneuron, reaching about 20% of their connectivity by 1- and 2-synapse connections. Upper right: over 50% of connections from sensory neurons to RPNs are made by 1-synapse connections. Nearly 40% of connectivity from sensory neurons to RPNs are made by 1- and 2-synapse connections. Lower left: sensory-receiving interneurons made more than 30% of their synaptic connections with 1-synapse and reached 20% of connectivity to RPNs with only 1- and 2-synapse connections. Lower right: non-sensory-receiving interneurons made less than 30% of their synaptic connections with 1-synapse and about 15% of their total connectivity to RPNs with 1- or 2-synapses. In general, sensory neurons made more ‘weak’ (one or two synapses) connections than interneurons to the RPNs. Thus, using a reconstruction threshold for interneurons of three synapses per connection to a RPN and using the minimal possible threshold of 1 for the sensory system connected to RPNs (having been reconstructed by Miroschnikow et al., 2018), it was possible to fully describe the RPN connectome with a completeness of 93%. For abbreviations, see Figure 2—figure supplement 4. In subsequent analysis, synaptic thresholds were chosen based on the scientific message we want to convey in the clearest possible manner and may differ depending on the type of graphs, schemes, or tables used. These can be presented in terms of absolute number of synapses or relative to a total number (e.g., percentage of total incoming synapses for a given neuron). One cannot say a priori which is more useful for a given figure as the number of synapses and synaptic partners can vary widely depending on the neuron.