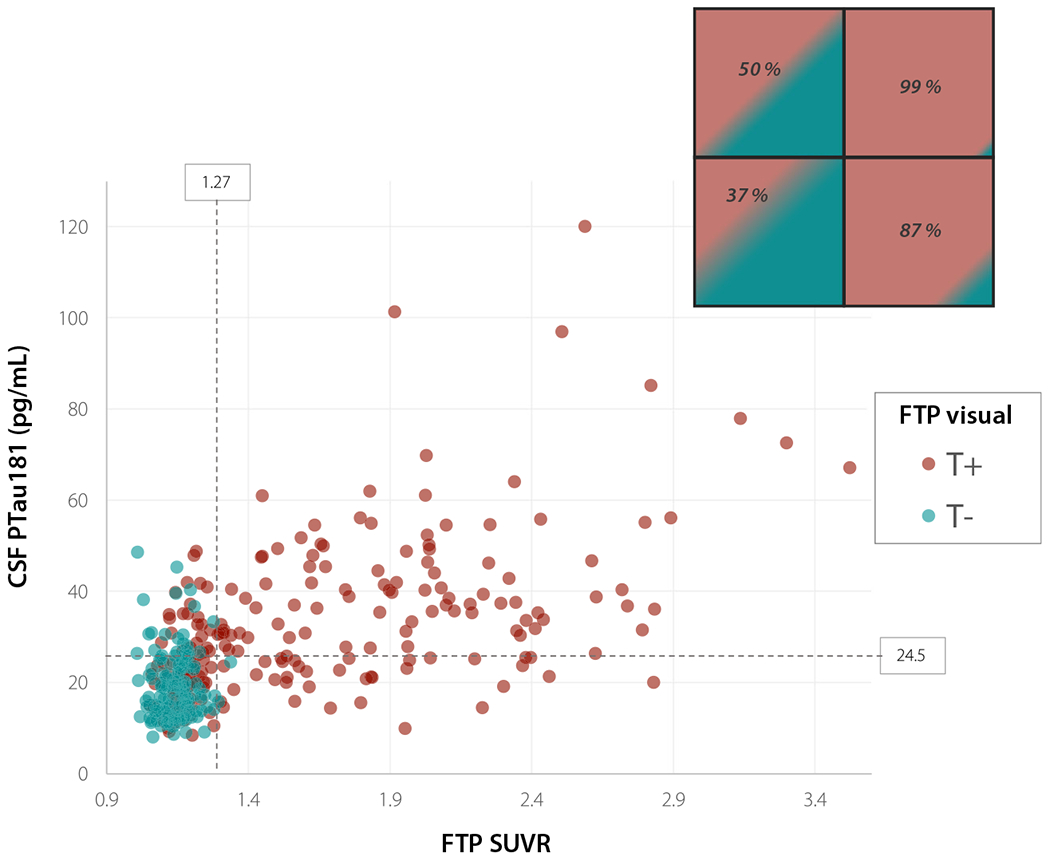
Fig. 5.

Scatterplot of CSF PTau181 and FTP SUVR values in T+ and T− patients by FTP visual assessment. Dotted lines show threshold of positivity for CSF PTau181 and FTP temporal meta-ROI SUVR. Insert in the top right corner shows percentage of T+ cases by visual assessment for each quadrant of the scatterplot
