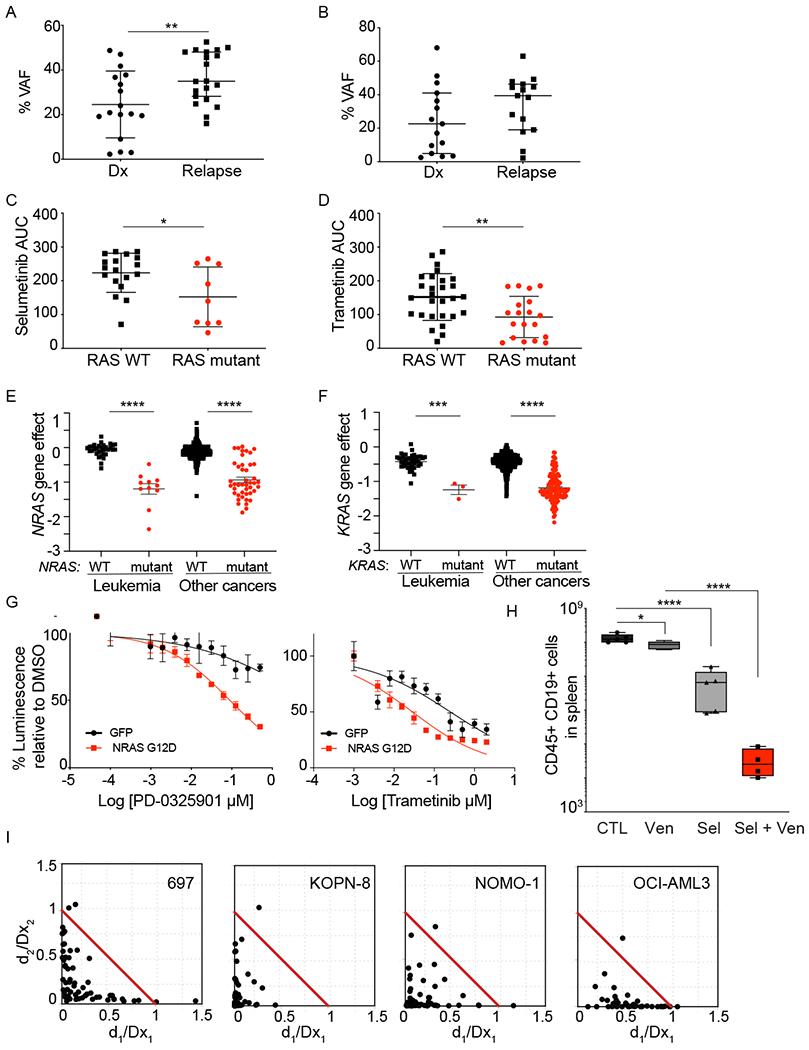
Figure 3: RAS pathway mutations are a therapeutic target in pediatric acute leukemia.

A) VAF for NRAS, KRAS, and PTPN11 mutations in patients with B-ALL on the LEAP trial compared to patients with newly-diagnosed B-ALL treated at Dana-Farber Cancer Institute. Leukemia samples were profiled using the same assay. **P<0.005 using Mann-Whitney test. B) VAF for NRAS, KRAS, and PTPN11 mutations in patients with AML on the LEAP trial. Primary leukemia samples from patients enrolled on the LEAP Consortium trial were tested ex vivo in response to MEK inhibitors. Samples with Ras pathway mutations (NRAS, KRAS, and PTPN11) were more sensitive to selumetinib (C) and trametinib (D), compared to WT samples. Shown is average area under the curve (AUC) for individual samples, with average +/− SD. *P<0.05 and **P<0.005 using unpaired t-test. Genome-scale CRISPR-Cas9 screen of 739 cell lines showed RAS mutant leukemia and other cell lines to be differentially dependent on NRAS (E) or KRAS (F) compared to RAS WT leukemia cell lines. Shown is the average gene effect +/− SEM. ****P<0.0001 using Mann-Whitney test. G) Expression of NRAS p.G12D in murine MLL-AF9 cells increased their sensitivity to MEK inhibitors, PD-0325901 and trametinib. Shown is average dose response +/− SEM, with 4 replicates. H) Patient-derived xenograft (PDX) model characterized by TCF3-HLF NRAS p.G12D was treated with venetoclax, selumetinib or venetoclax plus selumetinib. The combination of venetoclax with selumetinib decreased leukemia burden compared to mice treated with each drug individually. Data are flow cytometric quantification of total human CD45+ CD19+ ALL cells in harvested murine spleens (N=5). * P<0.01 and ****P<0.0001 using one-way ANOVA with Tukey’s post-test for multiple comparisons. I) Combination of selumetinib with venetoclax is synergistic across Ras pathway mutant acute leukemia cell lines. Synergy was assessed by Chou-Talalay combination index (CI) across the indicated cell lines. Normalized isobolograms depict CI scores over a range of concentrations. The coordinates of the CI scores are d1/Dx1 and d2/Dx2, where Dx1 is the concentration of drug 1 (selumetinib) that alone produces the fractional inhibition effect x, and Dx2 is the concentration of drug 2 (venetoclax) that alone produces the fractional inhibition effect x. The red line displayed is the line of additivity. Points below the line are synergistic and above the line are antagonistic. Cell viability was measured at 3 days of combination treatment using an ATP-based assay.
