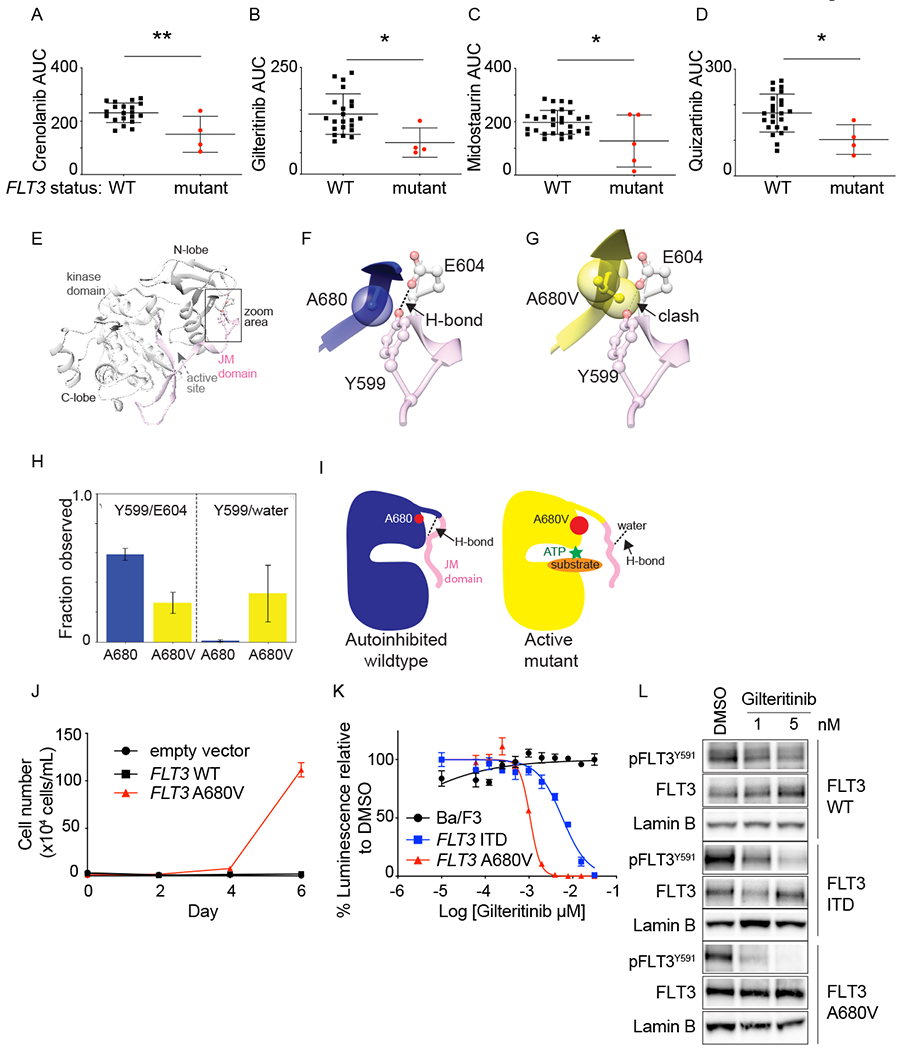
Figure 4: FLT3 activating mutations increased ex vivo sensitivity to FLT3 inhibitors.

Primary leukemia samples from patients enrolled on the LEAP Consortium trial were tested ex vivo with FLT3 inhibitors. Samples with FLT3 mutations were more sensitive to crenolanib (A), gilteritinib (B), midostaurin (C), and quizartinib (D), compared to FLT3 wildtype samples. Shown is area under the curve (AUC) for individual samples, mean +/− SD. *P<0.05 and **P<0.005, using unpaired t test. The first trial patient had AML with a FLT3 p.A680V mutation, which has been described but had unknown functional significance. (E) Crystal structure of auto-inhibited FLT3 kinase domain (grey) and JM domain (pink). Area surrounding residue 680 is highlighted. (F) Zoom in on residues A680 (blue) and (G) A680V (yellow) from active-like models of FLT3 shown relative to the Y599/E604 H-bond observed in the auto-inhibited crystal structure. (H) Prevalence of H-bonds between: Y599/E604 (left) and Y599/water molecules (right) in molecular dynamics simulations of inactive-like models. (I) Proposed mechanism of activation of the A680V mutation. J) Ba/F3 cells expressing empty vector, FLT3 WT or FLT3 p.A680V were grown without IL-3, and cells counted using trypan blue exclusion. Shown is the average number of cells ± SD of 3 replicates. K) Ba/F3 cells expressing FLT3-ITD or FLT3 p.A680V were tested with a range of gilteritinib concentrations and viability evaluated at day 2 by an ATP-based assay as a percentage of cells relative to DMSO control. Shown are the mean ± SD of 4 replicates. L) Western immunoblotting showing inhibition of FLT3 phosphorylation in response to gilteritinib treatment.
