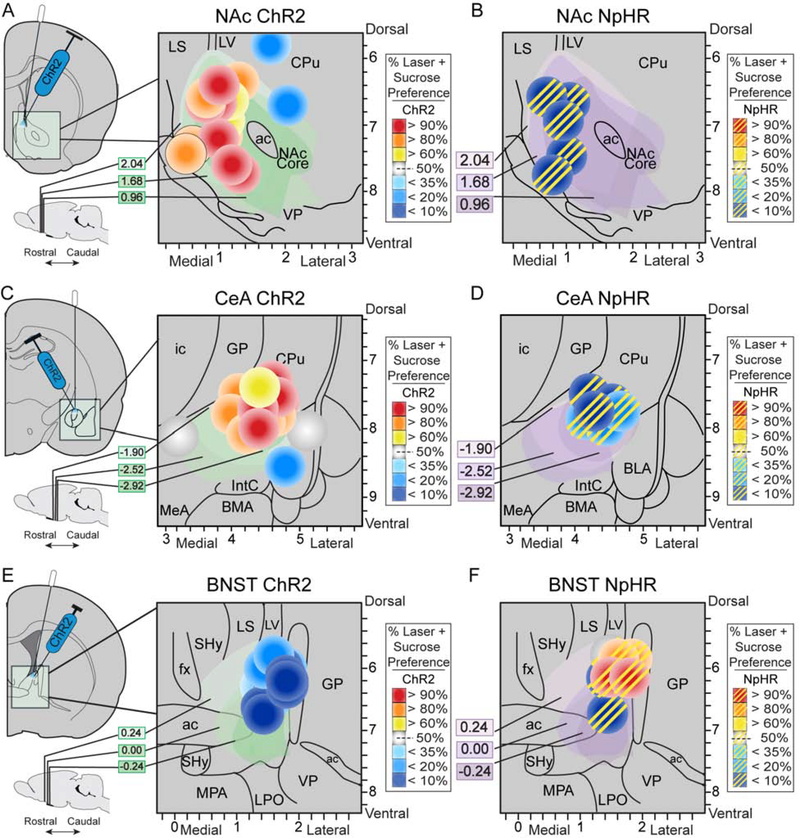
Figure 1. Localization of function maps.
Function maps of effects on sucrose preference in two-choice task of ChR2 stimulation of CRF-expressing neurons in A) NAc, C) CeA, and E) BNST. Maps for inhibitory halorhodopsin effects of laser illumination on CRF-expressing neurons shown in B) NAc, D) CeA, and F) BNST (striped symbols). Symbol sizes reflect size of optogenetic Fos plumes (see Fig. 2 and Supplementary results). Yellow, orange, or red symbol colors show intensity of enhancement of laser-induced preference for Laser+Sucrose option over Sucrose-alone option produced at that site (effects shown for days 6–8 of two-choice task). Conversely, blue colors show intensity of avoidance of Laser+Sucrose (i.e., preference instead for Sucrose-alone). Also see Table 1. CPu, caudate putamen; LV, lateral ventricle; LS, lateral septum; VP, ventral pallidum; ac, anterior commissure; ic, internal capsule; GP, globus pallidus; MeA, medial amygdala; IntC, intercalated amygdala; BMA, basomedial amygdala; BLA, basolateral amygdala; fx, fornix; SHy, septohypothalamic nucleus; MPA, medial preoptic area; LPO, lateral preoptic area.

