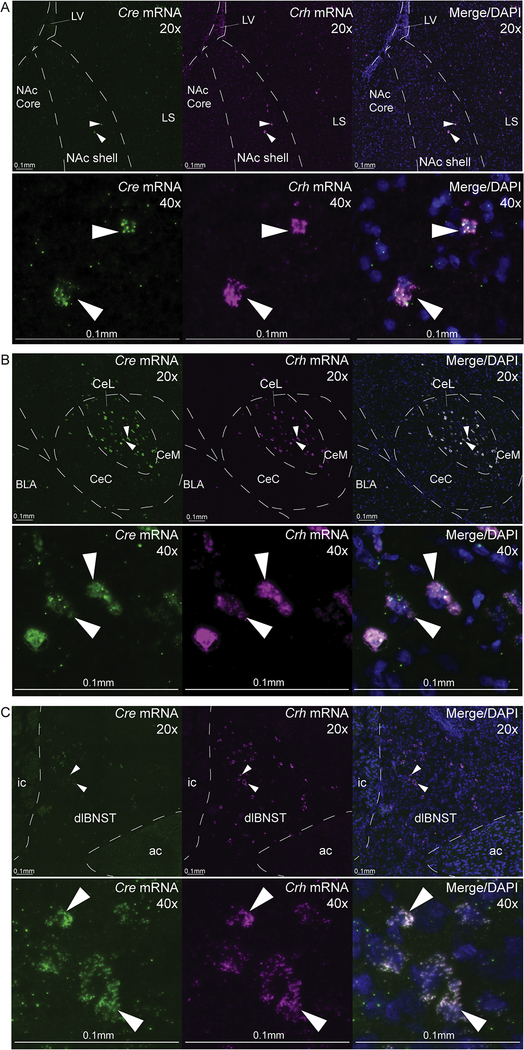
Figure 3. CRF and Cre colocalization verification through fluorescence in situ hybridization.
Representative images for Cre mRNA expression and Crh mRNA expression in A) nucleus accumbens (NAc) shell, B) lateral division of central amygdala (CeL), and C) dorsolateral division of bed nucleus of stria terminalis (dlBNST) in Crh-Cre+ rats (n=6). Low-power (20×) and high-power (40×) images show localization of neurons expressing Cre mRNA (green) or Crh mRNA (magenta), and Cre/CRF colocalization with cell bodies stained with DAPI (blue). Arrows point to examples of cells coexpressing Cre and Crh mRNAs. Scale bars denote 0.1mm at both 20× and 40×. See Supplementary methods and results. LV, lateral ventricle; LS, lateral septum; BLA, basolateral amygdala; CeC, capsular central amygdala, medial central amygdala; ic, internal capsule; ac, anterior commissure.

