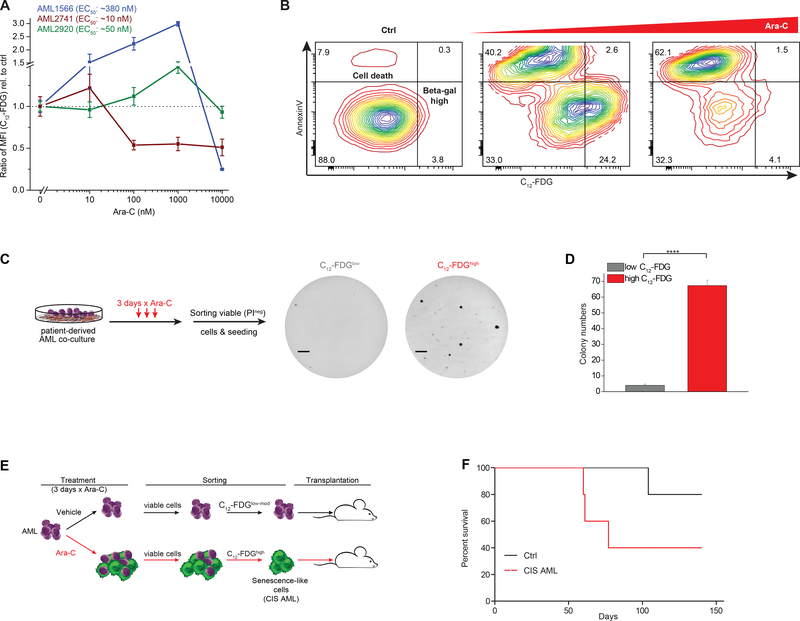
Figure 3. Chemotherapy-induced senescence is dose-dependent and capable of repopulating AML.
A, Three different patient-derived AML cases (including their EC50 values for Ara-C) were exposed from relatively low (10 nM) to highly toxic (10,000 nM) doses of Ara-C. SA-β-Gal activity was assessed by the ratio of median fluorescence intensity (MFI) of C12-FDG relative to untreated cells set as 1. B, Exemplary of AML cells measured by flow cytometry for SA-β-Gal activity with C12-FDG and Annexin V co-staining following moderate or high dose Ara-C exposure. Shown is the separation of apoptotic cells with reduced C12-FDG levels and the C12-FDGhigh viable fraction following Ara-C. C, D, Ara-C-treated patient-derived AML cells (AML1566) were sorted for low and high SA-β-gal signal and plated in methylcellulose. Colonies were counted after 3 weeks (F, line = 4 mm). Bar graph indicates mean (n=3) of colony numbers (G). (****P<0.0001, Student’s t-test, means of triplicate measurements ± s.d.). E, Schematic showing the treatment of patient-derived AML cells (AML1566) with Ara-C (1000 nM) for 3 days with subsequent sorting of non-senescent cells (untreated condition) and chemotherapy-induced senescence-like cells (CIS AML cells). F, Overall survival of mice after sorting leukemia cells that were untreated or exposed to Ara-C. Each group consisted of 5 NSG mice.

