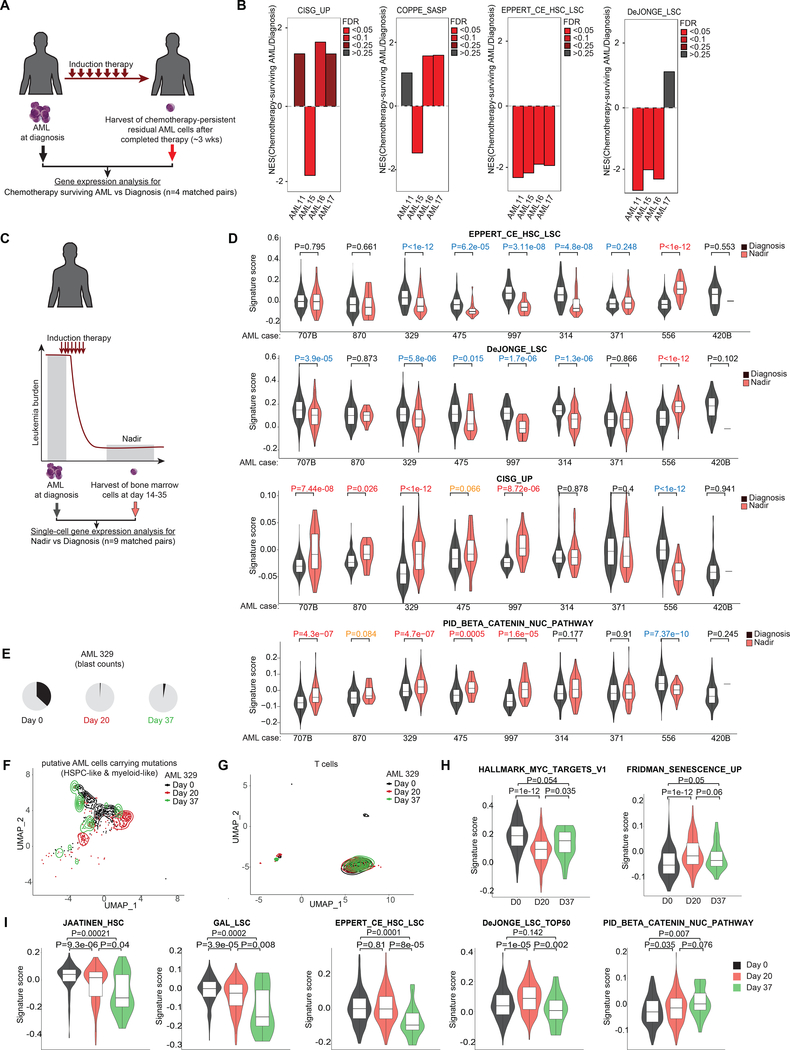
Figure 6: Chemotherapy-persistent cells are enriched for CIS cells instead of LSCs in patients.
A, Scheme showing AML samples from patients whose bone marrow disease persisted post-treatment despite successful blast reduction in peripheral circulation (4) (n=4). B, GSEA of chemotherapy-persistent AML shown in (A) using indicated gene sets. C, Scheme illustrating scRNA-seq (63) of bone marrow cells collected from AML patients at diagnosis and nadir following induction therapy. D, Violin plot showing signatures scores from (C) for selected gene sets in single cells composed of myeloid, myeloid-like, hematopoietic stem/ progenitor cells (HSPCs) and HSPCs-like cells characterized by Galen et al. 2019 (63). P values calculated by Wilcoxon signed-rank test between cells at nadir vs diagnosis. P values in red reflect significant upregulation in nadir samples vs diagnosis (orange depict tendency for upregulation), whereas values in blue represent significant downregulation. E, Pie charts showing the increase of blast counts of AML patient 329 at day 37 following induction chemotherapy (63). F, UMAP plot showing the distribution at diagnosis, day 20, and day 37 of putative AML cells composed of HSPC- and myeloid- like cells carrying AML-related mutant genes identified by van Galen et al. (63). G, UMAP plot showing the distribution at diagnosis, day 20, and day 37 of T cells. H, Violin plots showing the signature scores of MYC targets and senescence gene sets at single cell level in AML cells at diagnosis, day 20, and day 37 in #pt329 following induction therapy. I, Plots showing signature scores for selected LSC/HSC and β-catenin-associated gene sets in AML cells at indicated time points in #pt329.

