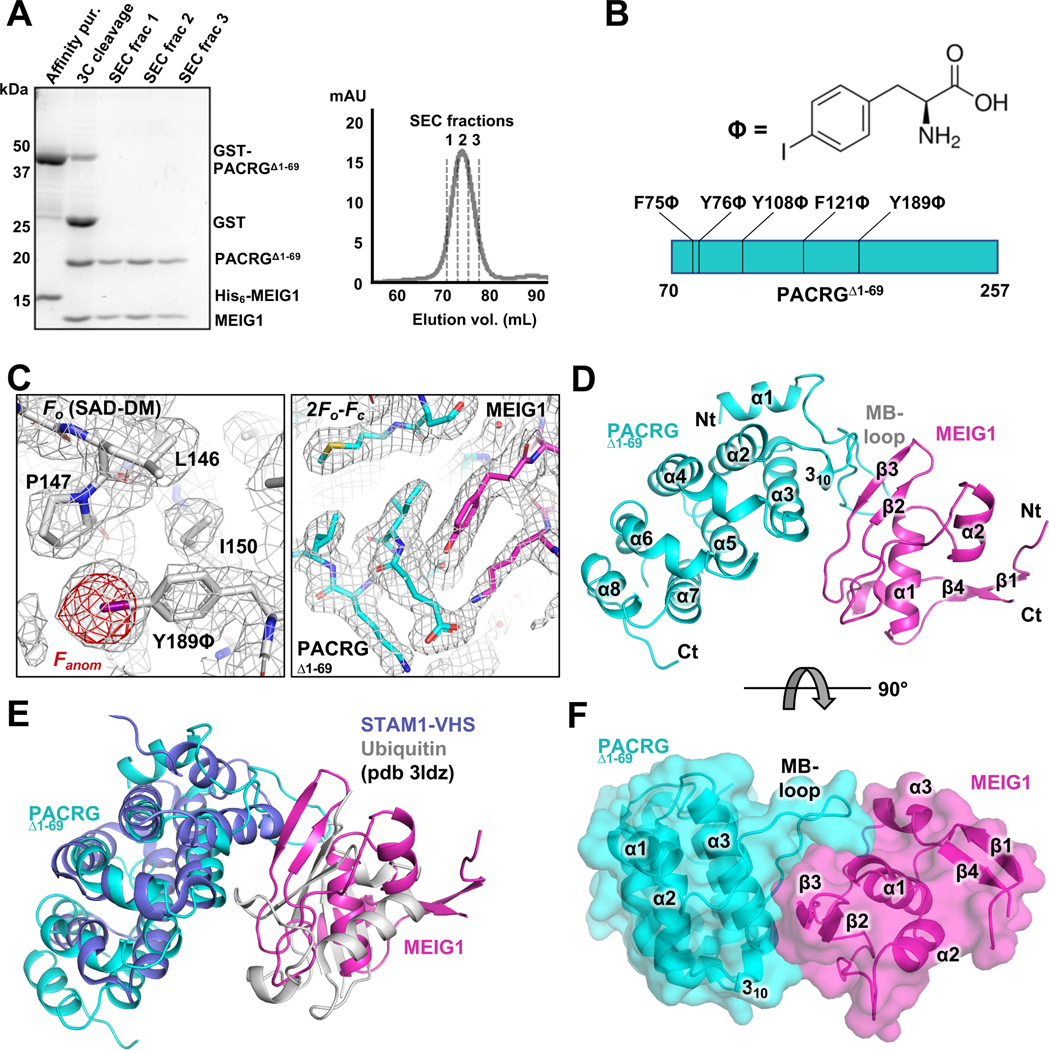
Figure 1. Crystal structure of the PACRG:MEIG1 complex.
(A) Purification of PACRGΔ1–69: MEIG1 by affinity and size-exclusion chromatography (SEC). Left, SDS-PAGE stained with Coomassie Blue. Lanes of the SEC fractions contain both MEIG1 and PACRGΔ1–69. (B) Chemical structure of p-iodo-L-phenylalanine and sites of incorporation in PACRG. (C) Left, electron density maps after SAD phasing and density modification (grey mesh), with the final refined model of the Y189ϕ derivative. The anomalous difference density map (red mesh) shows the position of iodine. Right, refined 2Fo-Fc electron density maps for the native complex of PACRGΔ1–69 (cyan) and MEIG1 (magenta). (D) Cartoon representation of the native complex of PACRGΔ1–69 and MEIG1. (E) Superposition of the STAM1-VHS domain bound to ubiquitin (violet and grey) on the PACRGΔ1–69:MEIG1 complex. (F) Surface representation of PACRGΔ1–69:MEIG1, rotated at 90° from the view in panel D.

