
Figure 2:
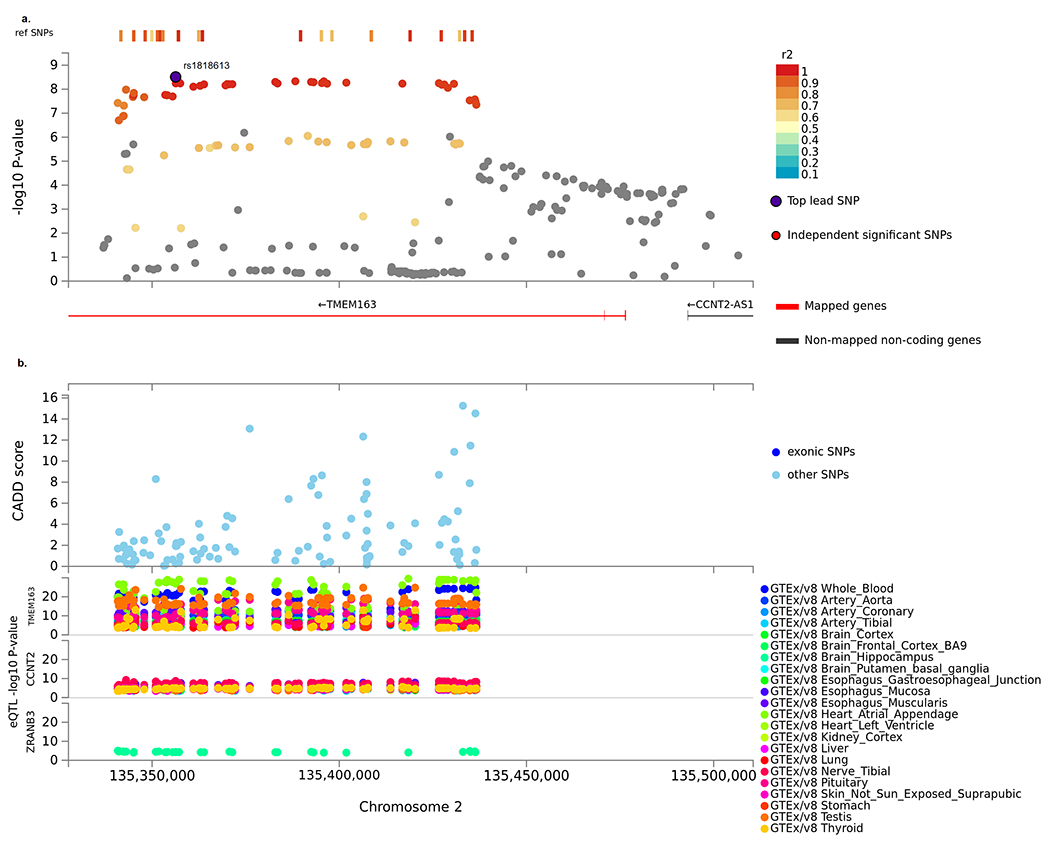
Locus plot of 2q21.3 region for the interaction GWAS of pancreatic cancer by smoking using FUMA. a. Extended region of the TMEM163 locus that prioritizes the TMEM163 gene. b. Zoomed in regional plot of TMEM163 locus with GWAS interaction P-values (SNPs are colored based on r2), Combined Annotation Dependent Depletion (CADD score), and Expression quantitative trait loci (eQTL) P-value for the most significant associations. eQTLs are plotted per gene and colored based on tissue types.